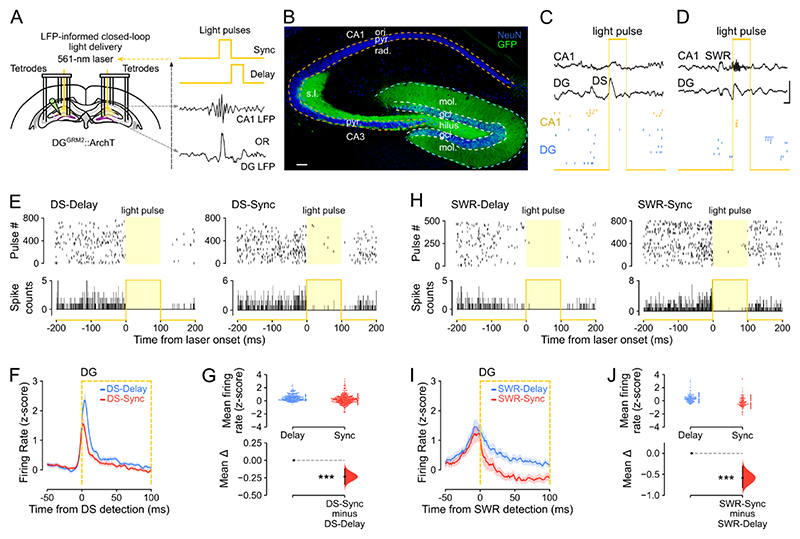
Figure 5. DS- and SWR-informed offline suppressions of DG granule cell activity.
(A) Triple-(DG-CA3-CA1) ensemble recording with LFP-informed yellow (561 nm) DG light-delivery. Dentate granule cells (DGCs) transduced with ArchT-GFP (DGGrm2::ArchT). Closed-loop light-delivery to suppress DGC spiking immediately upon either DS detection (DS-Sync condition) or SWR detection (SWR-Sync) or their respective control conditions (DS-Delay and SWR-Delay, where light delivery was offset by 100 ms after event detection).
(B) ArchT-GFP-expressing DGCs in a DGGrm2::ArchT mouse. Neuronal nuclei stained with NeuN. Scale bar=100 μm. Granule cell layer: gcl; molecular layer: mol; pyramidal cell layer: pyr; stratum oriens: ori; radiatum: rad; lucidum: s.l.
(C, D) Closed-loop feedback transiently silenced DGCs during either DG DS (C; “DS-Sync”) or CA1 SWR (D; “SWR-Sync”) events, illustrated with raw data examples. Scale bars, 30 ms (horizontal), 1.5 mV (vertical).
(E) Raster plots (event-related spiking response; one light pulse per row (Upper), and peri-event time histograms (Lower) showing photo-silencing of two example DG cells from a DGGrm2::ArchT mouse in DS-Delay and DS-Sync.
(F, G) Corresponding quantification of average DGC firing rate (z-score) for DS-Delay versus DS-Sync (F,G; n=548 cells in 9 mice). In F, the orange box shows the laser-on period for DS-Sync.
(H-J) As E-G but showing DGC photo-silencing during SWR-Delay and SWR-Sync conditions (I, J; n=181 cells in 3 mice). In I, the orange box shows the laser-on period for SWR-Sync.
For G and J, the test statistic is the mean difference, shown on the y-axis of each lower plot. P-values are from unpaired permutation tests, Delay versus Sync, ***P < 0.001.

