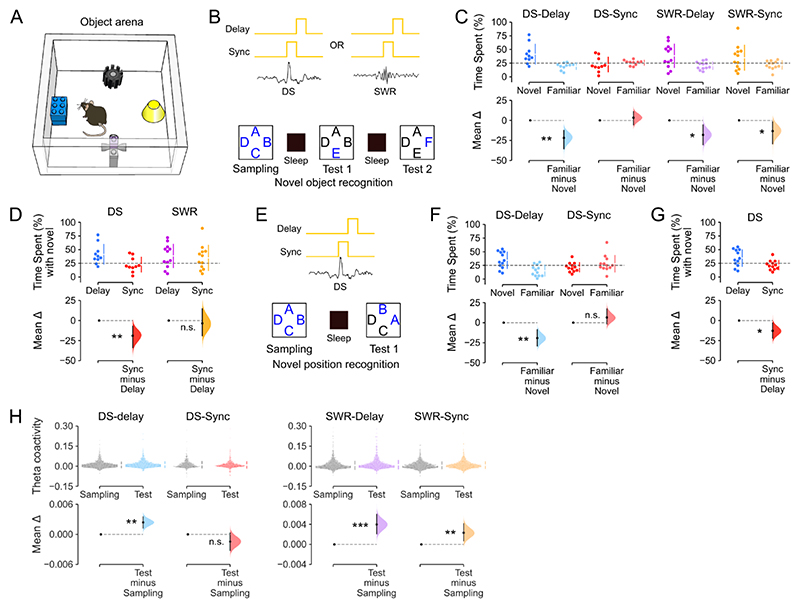
Figure 6. Offline suppression of DS activity impairs flexible recognition memory.
(A) Behavioral arena used for the recognition memory tasks.
(B-D) Offline DS events are required for novel object recognition memory. (B) Task layout. During sleep sessions (interposed between novel object exploration sessions), closed-loop optogenetic suppression of DG cells in DGGrm2::ArchT mice was achieved using real-time monitoring of either DG or CA1 LFPs to actuate either DS synchronized (DS-Sync) or delayed (DS-Delay), SWR synchronized (SWR-Sync) or delayed (SWR-Delay) DG light delivery. Letters depict object locations in the task arena (A), with novel objects in blue. (C) Estimation plot showing the percentage of time spent by mice with the novel versus the familiar objects in each of the four LFP-informed closed-loop conditions. Upper: Each data point represents the percentage time spent with the novel object versus the mean percentage time spent with the three familiar objects; chance performance is shown by the dashed line. Lower: mean difference between novel and familiar object exploration time. (D) as C but directly comparing novel object preference in the delay versus sync conditions for DS and SWR events. Mice in the DS-Delay, SWR-Delay, and SWR-Sync conditions, but not the DS-Sync condition, exhibited a significant preference for novel over familiar objects (DS-Delay and DS-Sync: n=10 sessions, in 3 mice; SWR-Delay and SWR-Sync: n=12 sessions in 3 mice).
(E-G) Likewise, offline DS events are required for novel position recognition memory. (E) Task layout. Letters depict object locations, with novel positions in blue. (F) Estimation plot showing the percentage of time spent by DGGrm2::ArchT mice with the novel versus the familiar object locations following sleep sessions with DS-Sync or DS-Delay suppression of DG cells. Upper: Each data point represents the percentage time spent with objects in novel locations versus objects in familiar locations; chance performance is shown by the dashed line. Lower: mean difference between novel and familiar location exploration times. (G) As F but directly comparing novel location preference in DS-Delay versus DS-Sync. Mice in the DS-Delay but not the DS-Sync condition exhibited a significant preference for objects in novel over familiar locations (n=12 novel versus n=12 familiar locations, 6 sessions, in 4 mice).
(H) In the object recognition task, the theta peer-to-peer coactivity increased from the initial object sampling to the memory test following offline DG cell suppression in the DS-Delay, SWR-Delay, and SWR-Sync conditions; but this was not the case in the DS-sync condition (where mice exhibited no novel object preference). Paired estimation plot showing theta coactivity during Sampling versus Test. Upper: each point represents a beta coefficient for the theta-nested peer-to-peer coactivity between pairs of hippocampal principal cells (n=1537, n=678, n=1719, n=1482 cell pairs, respectively, in 6 mice). Lower: black dot, mean difference between sampling and test sessions; black ticks, 95% confidence interval.
For C,D and F-H, the test statistic is the mean difference, shown on the y-axis of each lower plot. P-values are from paired permutation tests, Familiar versus Novel (C,F); Delay versus Sync (D,G); or Test versus Sampling (H), *P < 0.05, **P < 0.01, ***P < 0.001.

