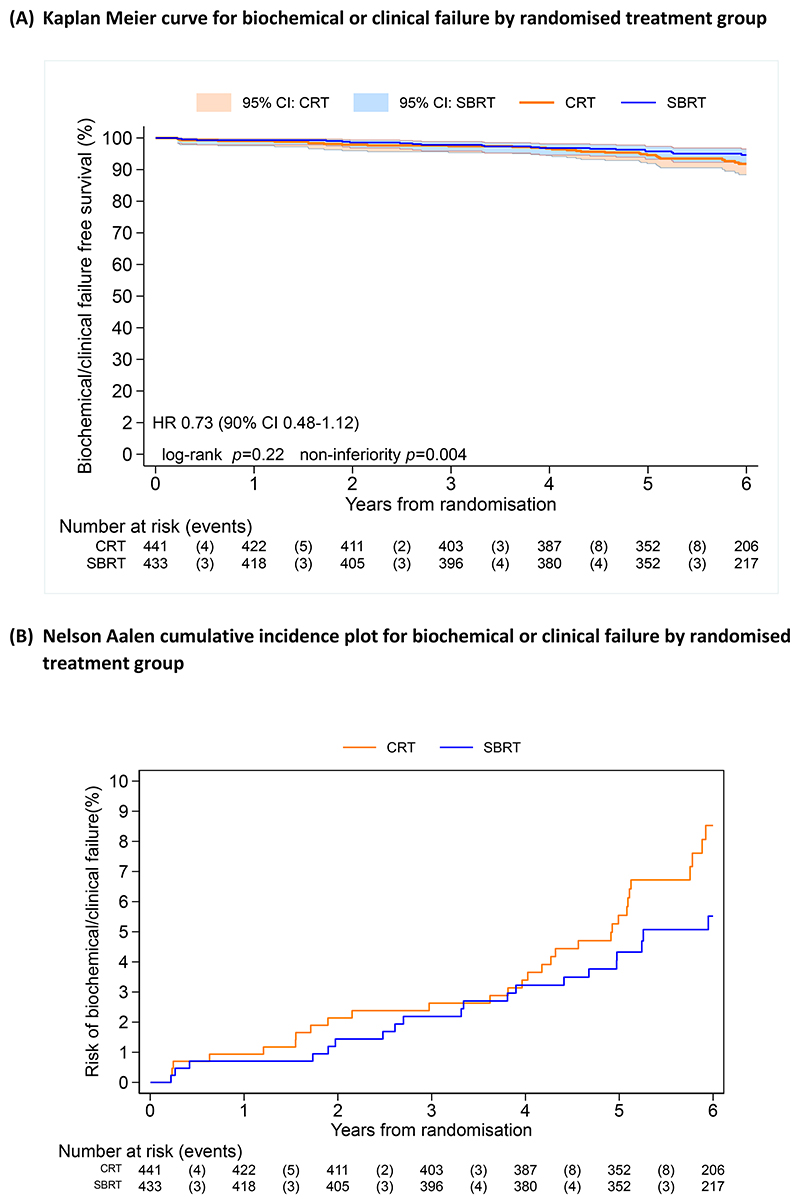
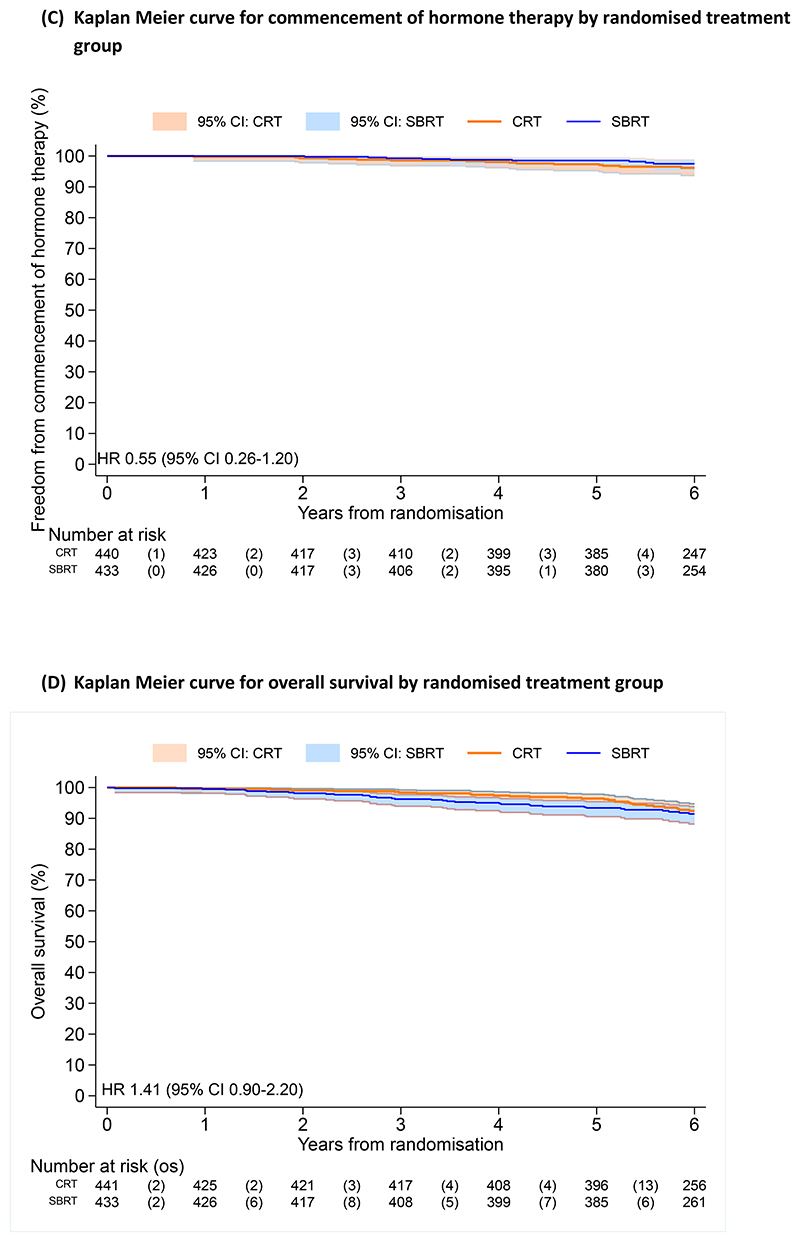
Figure 1.
Efficacy outcomes (A) Kaplan Meier curve for biochemical or clinical failure by randomised treatment group, (B) Nelson Aalen cumulative incidence plot for biochemical or clinical failure by randomised treatment group, (C) Kaplan Meier curve for commencement of hormone therapy by treatment group, (D) Kaplan Meier curve for overall survival by randomised treatment group


