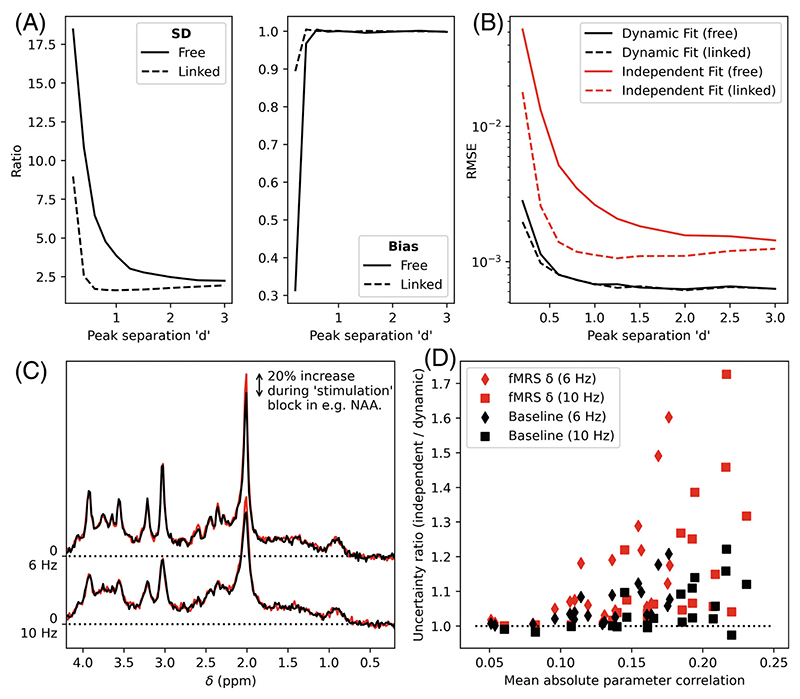
Figure 2. Results of the functional MRS validation.
(A) Ratio of Monte Carlo measured SDs and bias (independent fitting/dynamic fitting) for the concentration increase as a function of peak separation in the toy two-peak simulation (see Figure S3). Results for a model with all parameters unlinked “Free” and the standard FSL-MRS fitting model “Linked” are given (see §Functional MRS–Simulation). (B) RMSEs for the same simulation. As shown in A&B Dynamic fitting reduces uncertainty and overall error. (C) Extension of fMRS validation to realistic 1H-MRS data. Paired data with 20% increases in concentration were simulated for each metabolite (NAA shown) at two linewidths. (D) The uncertainty ratio (ratio of SDs, independent fitting/dynamic fitting) for each metabolite’s baseline concentration and increase (delta) is shown as a function of the parameter’s mean correlation with other parameters (see Figure S4). A value >1 indicates that dynamic fitting is decreasing the uncertainty compared to independent fitting.

