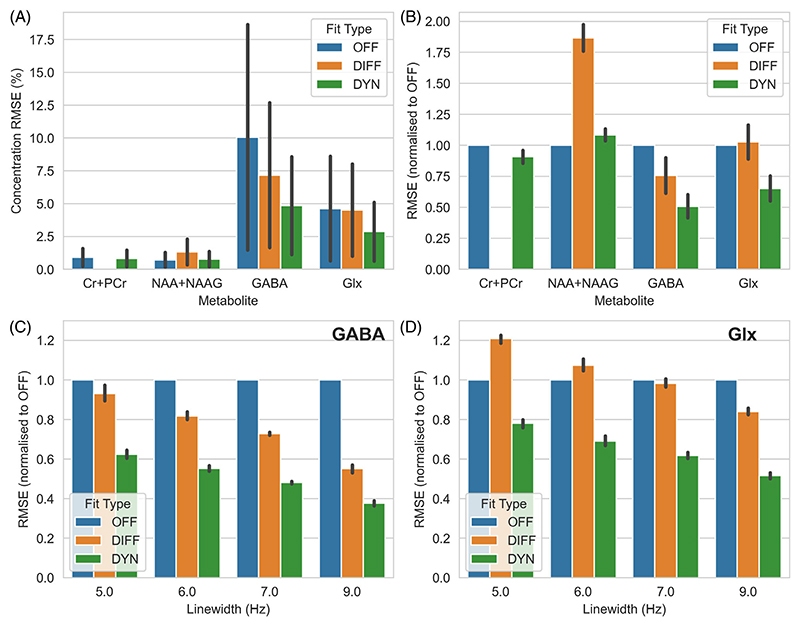
Figure 4. Results of the editing simulation.
(A) RMSE (±SD) across all noise levels and linewidths for each examined metabolite, expressed as percentage of the true metabolite concentration. (B) As (A), but with the results normalized to OFF for each metabolite. (C, D) The effect of linewidth on the relative performance for GABA and Glx (glutamate + glutamine). In all cases, except the measurement of NAA + NAAG, the RMSE is lowest for the dynamic approach.

