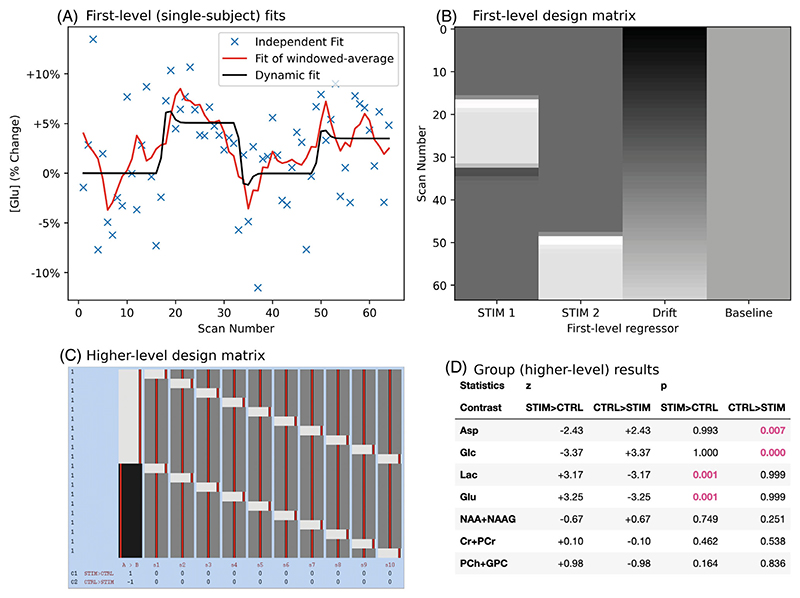
Figure 5. Subject and group analysis of functional MRS using a GLM.
(A) Single subject fit of glutamate. A single subject’s stimulation data are shown for relative glutamate changes. Independent, moving-window temporally smoothed, and dynamically modeled results are shown. Note that no formal comparison is made to the moving-window method, comparison of dynamic fitting to independent fitting is made in CS1. (B) Design matrix used to both generate and fit the fMRS data at the first level. There are two stimulation regressors, a linear drift regressor and a constant regressor. (C) The group level analysis used this design matrix to run a paired t-test for stimulation and control (no effect) datasets. Each row indicates one scan (control or stimulation) with all stimulation listed first, columns show each explanatory variable with a value of −1 (black), 0 (dark gray), or 1 (gray). The matrix was created and displayed using FSL tools as explained at Reference 42. (D) Output of FSL-MRS’s fmrs_stats tool showing group z and p statistics for each first-level contrast. The tool accurately identifies the metabolites changing in the simulation as significant.

