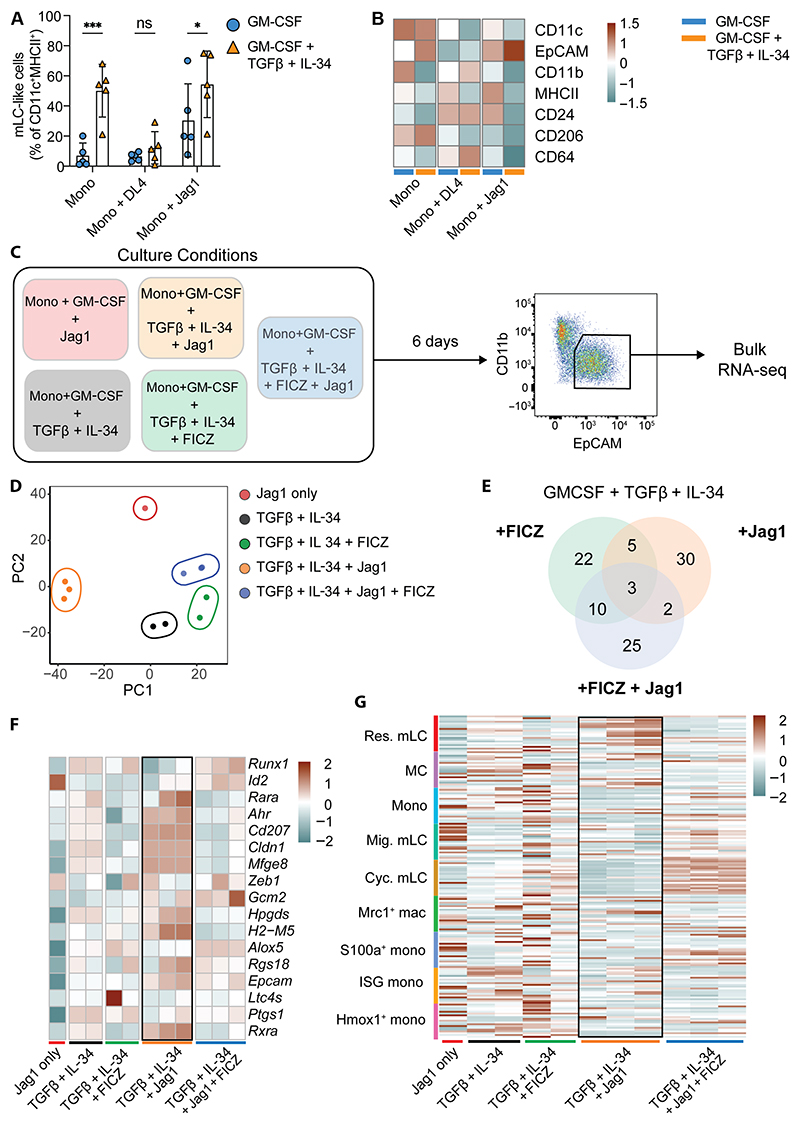
Fig. 5. Notch signaling is sufficient to program mLC differentiation.
(A) Bar graph showing the proportion of mLC-like cells generated from monocytes cultured with GM-CSF alone or GM-CSF, TGFβ, and IL-34 in the presence or absence of indicated Notch ligands (see fig. S7A for gating strategy). Data are shown as means ± SD (n = 5). Significance was calculated by two-way ANOVA with uncorrected Fisher’s least significant difference for multiple comparisons, *P < 0.05; ***P < 0.001. (B) Heatmap showing average gMFI of indicated markers from BM-derived monocytes cultured and analyzed by flow cytometry as indicated in (A) (n = 5). (C) Experimental setup for bulk RNA-seq of mLC-like cells generated under the indicated conditions. (D) PCA plot of bulk RNA-seq samples colored by culture condition. (E) Venn diagram showing numbers of common and unique DEGs between the indicated conditions. (F) Heatmap showing scaled expression of LC signature genes across samples. (G) Heatmap showing expression of gene signatures from epidermal myeloid cell clusters (defined as top 20 DEGs) (y axis) across bulk RNA-seq samples (x axis).

