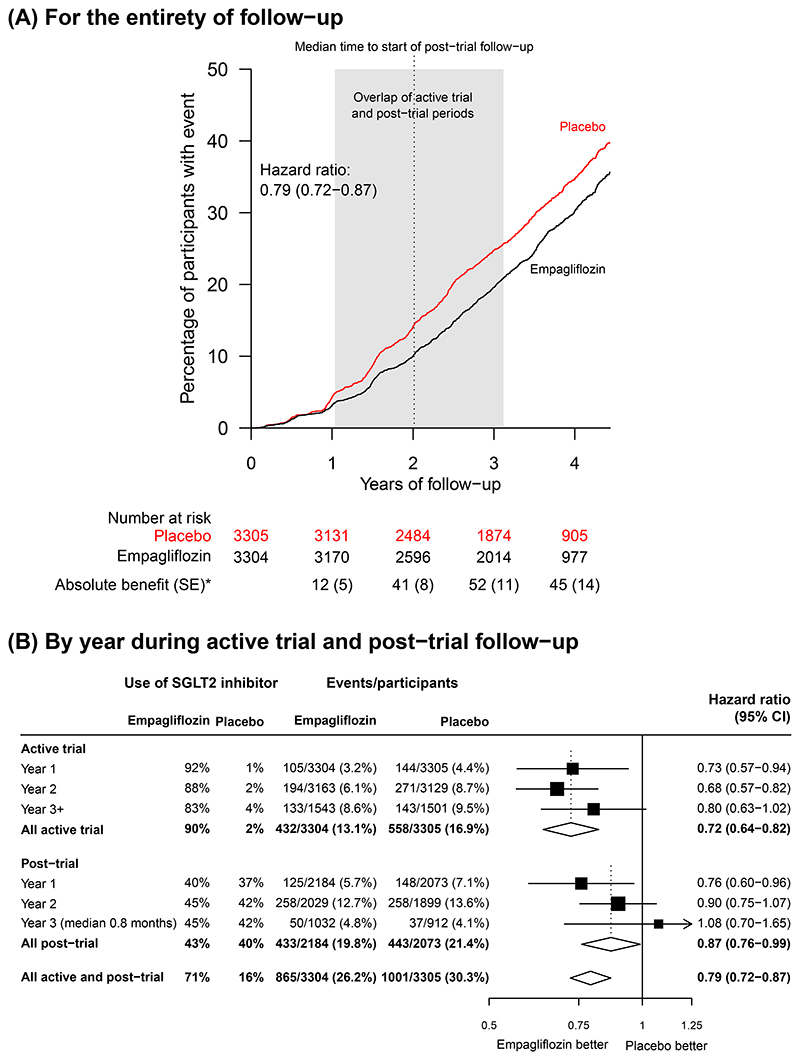
Figure 1. Effect of Allocation to Empagliflozin on Progression of Kidney Disease or Death from Cardiovascular Causes.
* Absolute difference in number of events per 1000 patients allocated to receive empagliflozin during the active trial period.
Figure 1A provides the KM-plot for the primary outcome for the entire follow-up period (active and post-trial periods combined). The shaded area is wide as median follow-up of the active trial period was 2.0 years with range of 0.3-3.1 years. This wide range is a result of prolonged recruitment during the Covid-19 pandemic. By contrast, Figure 1B displays the annual ratios of the hazard rates in those originally allocated empagliflozin versus those originally allocated placebo separately for (a) the active trial, and (b) the post-trial period, during which time no participant took study drug but some were started on non-trial SGLT2i (not necessarily empagliflozin). Primary outcomes in the first 6 months post-trial 32/2184 (1.5%) vs. 49/2073 (2.4%), hazard ratio 0.60 (95% CI 0.38-0.93). Use of SGLT2 inhibitor defined in Table 2. Average use of SGLT2 inhibitors calculated using weights proportional to the total person years at risk in each year. Denominators are the number of participants still at risk of a first primary outcome at the start of the risk period.

