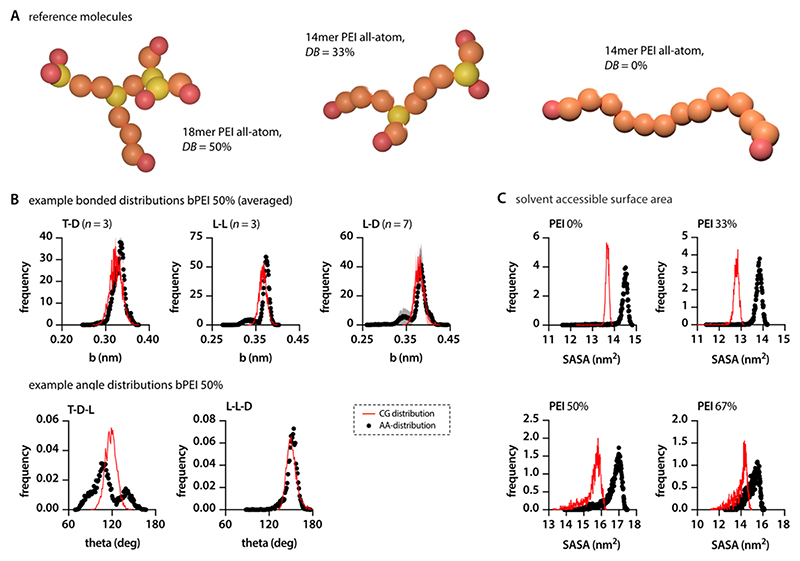
Figure 2. Validation of the PEI model.
(A) Additional PEI structures that can be differentiated regarding their DB were designed to validate the parametrization. (B) Comparing the bonded and angle distributions of AA and CG simulations for bPEI50 confirms the accuracy of the parametrization. Example bonds presented here (T-D, L-L, L-D) represent mean ± SD from all similar bonds within the test molecule. (C) Solvent-accessible surface area in CG simulations is slightly lower when compared to the corresponding AA runs.

