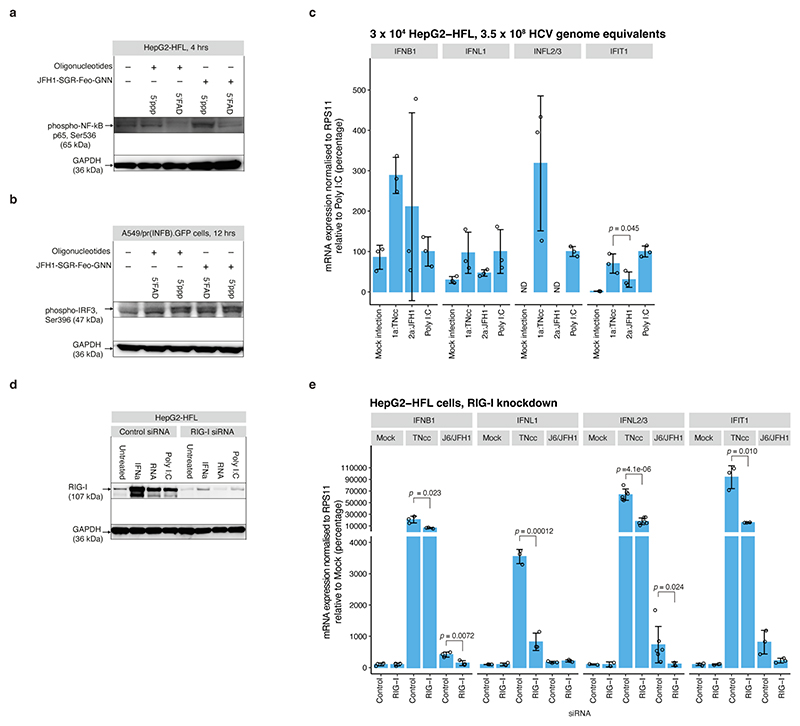
Extended Data Fig.10 |. RNA stimulation of innate immune responses.
(a) Immunoblot for phosphorylated NF-kB subunit p65 in HepG2-HFL cells 4 hrs after stimulation with 5’ppp or 5’FAD as indicated. (b) Immunoblot for phosphorylated IRF3 in A549/pr(IFNβ).GFP cells 12 hrs after stimulation with 5’ppp or 5’FAD as indicated. The upper band, consistent with the size of p-IRF3 appears only after stimulation. Note the different loading order compared to panel (a). (c) mRNA expression levels for IFNB1, IFNL1, IFNL2/3 and IFIT1 18 hrs post infection of HepG2-HFL cells with equal RNA titers of indicated HCV strains shown relative to polyI:C induced levels. Data represent mean +/− SD (n=3 biological replicates). ND: Not detected. (d) Immunoblot for RIG-I after control or RIGI siRNA mediated knock-down in HepG2-HFL cells and induction of RIG-I expression by transfection of 100 ng in vitro transcribed 5´ppp J6/JFH1 RNA, 100 ng Poly I:C or treatment with 500 U/mL IFN-a 2a. (e) mRNA expression levels for IFNB1, IFNL1, IFNL2/3 and IFIT1 18 hrs post infection of HepG2-HFL cells with indicated HCV strains shown relative to levels obtained for Mock infected control siRNA treated cells. Data represent mean +/− SD (n=3 biological replicates). Prior to infection, cells were transfected with control siRNA or RIGI targeting siRNA. The p-values in (c) and (e) are calculated using one-sided Welch’s unequal variances t-test by comparing to the mock infection samples. For gel source data, see Supplementary Figure 1.

