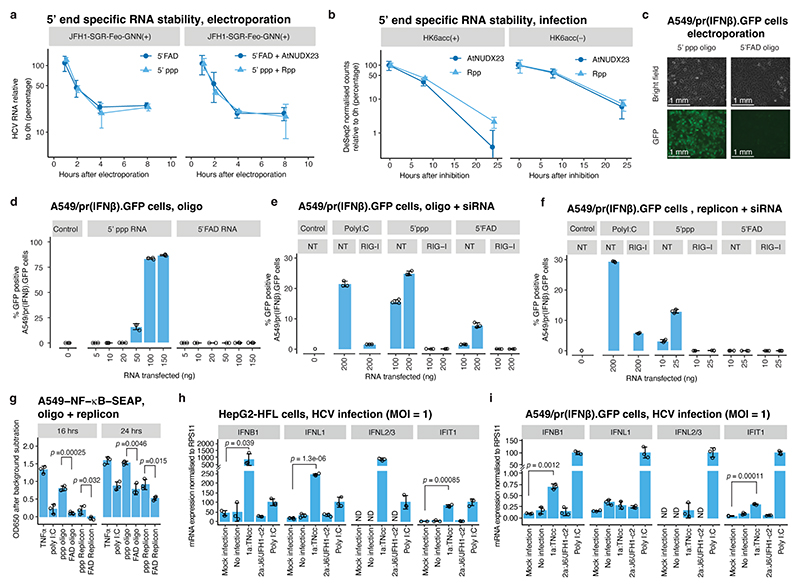
Fig. 4 |. Functional implications of 5’FAD capping.
(a) Stability of 5’ppp and 5’FAD capped in vitro transcribed non-replicating JFH1-SGR-Feo-GNN RNA determined by RT-qPCR after electroporation into Huh7.5 cells. Controls treated with Rpp or AtNUDX23 to generate 5’p are shown for comparison. (b) Stability of 5’ppp and 5’FAD sub-populations of HK6acc (+) and (–) RNA after inhibition of replication by the NS5B inhibitor, beclabuvir, was quantified using CapZyme-seq with Rpp (5’ppp) or AtNUDX23 (5’FAD) enrichment. The 5’ end counts were normalized between libraries and control sample counts subtracted. (c) 5’ppp or 5’ FAD in vitro transcribed RNA oligos were transfected into A549/pr(IFNβ).GFP cells containing a GFP reporter under control of the IFN-β promoter. Images of bright field and GFP channel 48 hrs after transfection are shown. (d) Transfection of RNA oligos as in (c) but with increasing doses and analysis using flow-cytometry. (e) Transfection of RNA oligos as in (d) but in cells pretreated with siRNAs targeting RIG-I or no target (NT). Flow-cytometry was performed 24 hrs after oligo transfection. (f) Transfection as in (e) but using JFH1-SGR-Feo-GNN replicon RNA. (g) Transfection of RNA oligos (150 ng), JFH1-SGR-Feo-GNN RNA (25 ng) or poly I:C (25 ng) into A549-NF-κB-SEAP reporter cells or stimulation with 5ng/mL TNF-α. OD650 was determined at indicated timepoints. (h) mRNA expression levels for IFNB1, IFNL1, IFNL2/3 and IFIT1 18 hrs post infection of HepG2-HFL cells with MOI=1 of indicated HCV strains shown relative to poly I:C induced levels (n=3). P-values compared to mock are shown for samples significantly different from both controls (non-treated and mock supernatant concentrated in parallel with virus stocks). (i) mRNA expression levels as in (h) but in A549/pr(IFNβ).GFP cells 24 hours post infection. ND: Not detected. (a-i) Data are presented as mean +/− SD (n=3 biological replicates.). The p-values in (g-i) are calculated using one-sided Welch’s unequal variances t-test.

