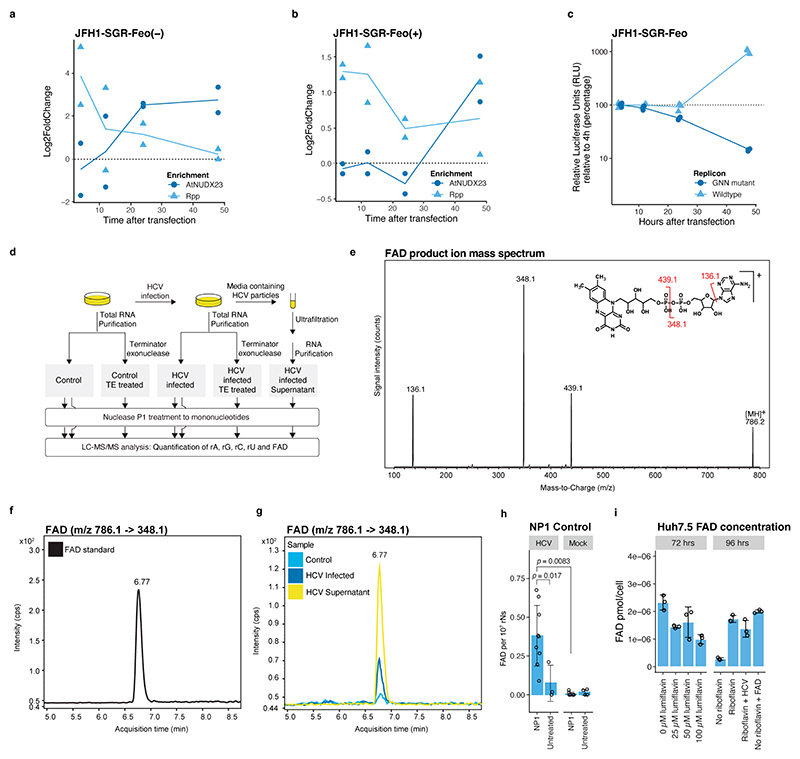
Extended Data Fig.4 |. Time course analysis of 5’ capping for JFH1-SGR-Feo replicon and LC-MS/MS detection of RNA 5’FAD caps.
(a) Enrichment of 5’ terminal reads for JFH1-SGR-Feo (–) at the indicated time points. DESeq2 log2(fold change) values were calculated by comparison of enzyme treatment (AtNUDX23 in dark blue and Rpp in light blue) to no enzyme control libraries. The 4 and 12 hrs time points for JFH1-SGR-Feo (–) are associated with uncertainty, because of low counts. (n=2 biological replicates; mean is represented by the line). (b) As in (a) but for JFH1-SGR-Feo (+). (c) Analysis of viral replication at different time points. Relative luciferase units (RLU) show HCV IRES mediated translation, and replication levels can be deduced by comparing JFH1-SGR-Feo to JFH1-SGR-Feo-GNN (catalytically dead replicon control) at the indicated time points after transfection (n=3 biological replicates). (d) Sample preparation for FAD detection using LC-MS/MS. (e) FAD product ion mass spectrum. Insert shows the structure of FAD with the detected ions indicated. (f) LC-MS/MS chromatogram showing the detection of the FAD control. (g) LC-MS/MS chromatogram showing the detection of FAD in a control Huh7.5 mock-infected sample (light blue), intracellular RNA from HCV infected Huh7.5 cells (dark blue) and in HCV particles concentrated from supernatant (yellow). (h) LC-MS/MS FAD quantification. FAD concentration based on internal stable isotope-labelled standards for FAD and normalization to ribonucleotide content. RNA was isolated from J6/JFH1 infected or control Huh7.5 cells (mock) and treated with or without Nuclease P1. Due to different lot activities, lower concentration of Nuclease P1 (0.006 U/μg total RNA) was used here, compared to the experiment presented in Fig. 1g (0.12 U/μg total RNA), resulting in lower FAD/rNs ratios. The p-values are calculated using one-sided Welch’s unequal variances t-test. Data are presented as mean +/− SD (from left to right n = 9, 3, 9 and 6 biological replicates). (i) Intracellular FAD levels in Huh7.5 cells with and without riboflavin and HCV infection or after lumiflavin treatment. Cells were cultured with or without supplementation of riboflavin (0.4 mg/L) or FAD (10 μM) or were treated with increasing lumiflavin concentrations. HCV indicates infection with J6/JFH1. Fluorescence measurements were used for FAD quantification; shown values for FAD pmol/cell were calculated using a standard curve. Data are presented as mean +/− SD (n=3 biological replicates).

