Figure.
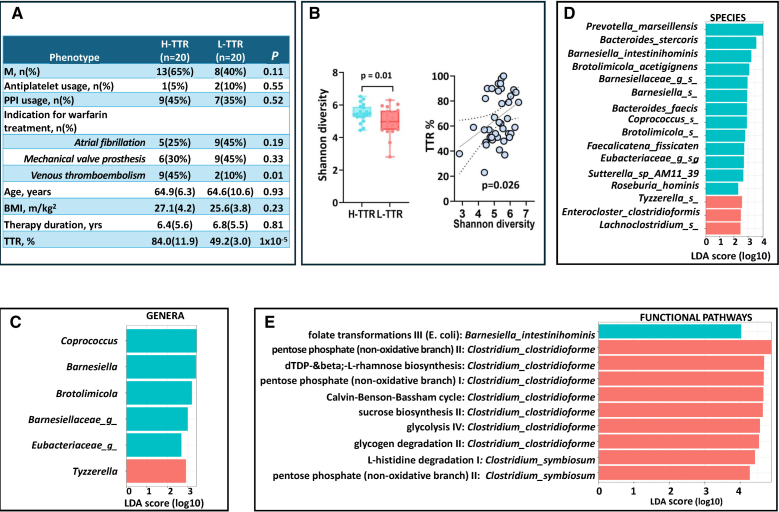
Association between gut microbiome composition, functional pathways, and time in the therapeutic range (TTR) in warfarin-treated patients. A, Descriptive characteristics of the study population comprising 20 middle aged patients (64.9 [SD=5.3] years) with TTR >60% (high TTR [H-TTR]) and 20 middle aged patients (64.7 [SD=10.6] years) with TTR ≤60% (low TTR [L-TTR]) enrolled between November 2023 and January 2024. All patients were treated with warfarin following European Society of Cardiology guidelines. Individuals who temporarily interrupted warfarin in the previous 6 months because of surgery or invasive procedures and were switched to heparin, or those who were taking antibiotics were excluded. The 3 main clinical indications for warfarin treatment were (1) prevention of cardioembolic ischemic stroke in atrial fibrillation (n=14); (2) mechanical heart valve prosthesis (n=15); and (3) treatment and secondary prevention of venous thromboembolism (n=11). B, Scatterplot depicting the relationship between Shannon alpha diversity and TTR (as a continuous trait) and box plot showing the difference in Shannon alpha diversity in H-TTR (TTR, >60%) and L-TTR (TTR, ≤60%). The difference observed corresponds to 0.91 SD, which has 78% power at alpha=0.05. The Shannon alpha diversity index was calculated using the estimate_richness function from the phyloseq package. The model including only covariates (for age, sex, BMI, proton pump inhibitor usage, clinical indication for warfarin, and months on warfarin therapy) achieves an area under the curve of 0.77. C, Bar plot showing the linear discriminant analysis (LDA) effect size of the list of genera, (D) species and (E) pathways enriched in H-TTR and L-TTR using LDA effect size (LEFSe) analysis. We included genera and species with abundance >0.05 present in ≥10% of the sample. The LEFSe analysis indicates differential signatures based on TTR. The LDA scores represent the effect size of each differentially abundant taxa/pathway between H-TTR and L-TTR. It is defined as the degree of consistent difference in abundance between 2 groups and measures how well a feature can differentiate between groups. It is calculated by balancing the feature’s variability and its ability to separate the groups, and then scaling and taking the base-10 logarithm of this value to rank the importance of each feature. Taxa at each level and pathways are shaded blue (H-TTR) or red (L-TTR) in which it is more abundant (P<0.01; q<0.25; LDA, >2.0). BMI indicates body mass index.

