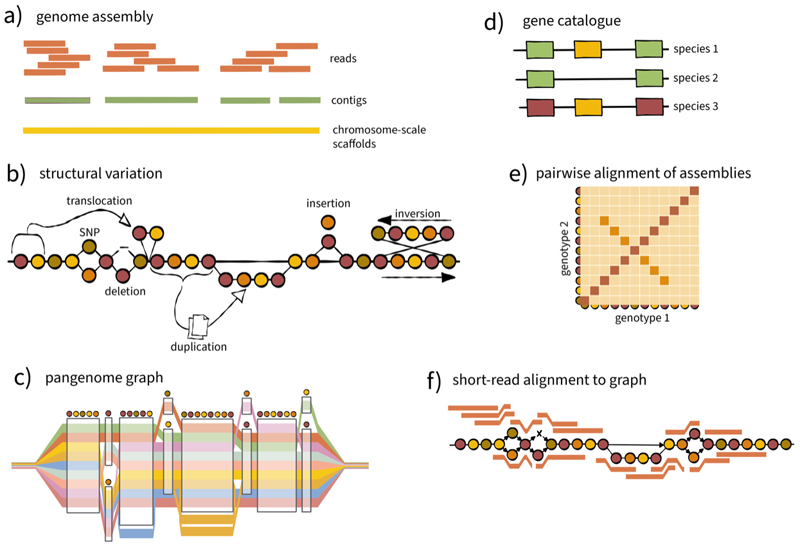
Figure 1. Pangenomics: assembly and comparison of genome sequences.
(a) Sequence reads, these days mostly long (>15 kb) reads, are assembled into contigs, which are arranged into chromosome-scale scaffolds (pseudomolecules) with the help of genetic and physical linkage information (dashed lines). (b) Comparisons of sequence assemblies reveal the full spectrum of sequence variation in the assembled genomes. (c) Pangenome graphs are computational representations of the assemblies and the differences between them. In this example, colour bands represent genomes as paths through the pangenome graph. Graphs with single base pair resolution are still challenging to construct at the whole-genome level. (d) A gene-centric view reduces complexity as do (e) pairwise alignments of genome sequences. (f) Short-read data (red bars), which is used for population-scale resequencing, can be integrated with pangenomes, for example, by aligning them to pangenome graphs.

