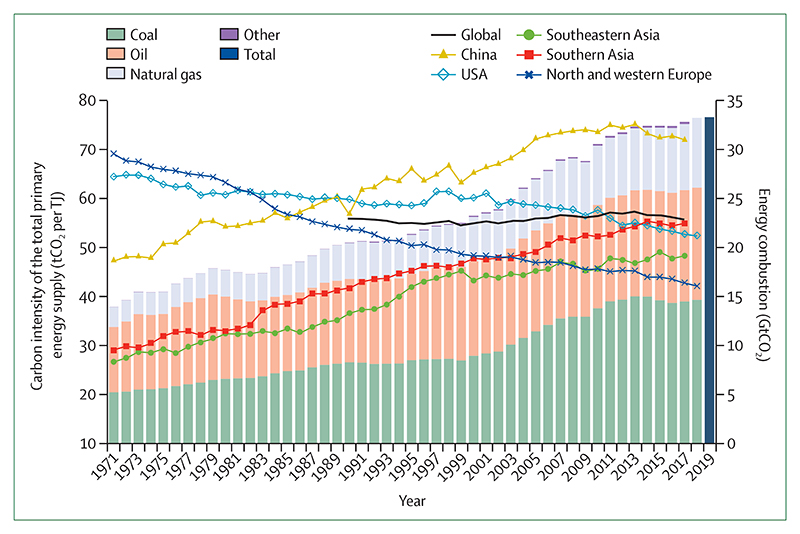
Figure 11. Carbon intensity of the total primary energy supply for selected regions and countries and global CO2 emissions by fuel type, 1971–2019.
Carbon intensity trends are shown by a trend line (primary axis) and global CO2 emissions by stacked bars (secondary axis). This carbon intensity metric estimates the tCO2 for each unit of total primary energy supplied (tCO2 per TJ). For reference, the carbon intensity of fuels are as follows: coal, 95–100 tCO2 per TJ; oil, 70–75 tCO2 per TJ; and natural gas, 56 tCO2 per TJ. CO2=carbon dioxide. tCO2=tonnes of carbon dioxide.

