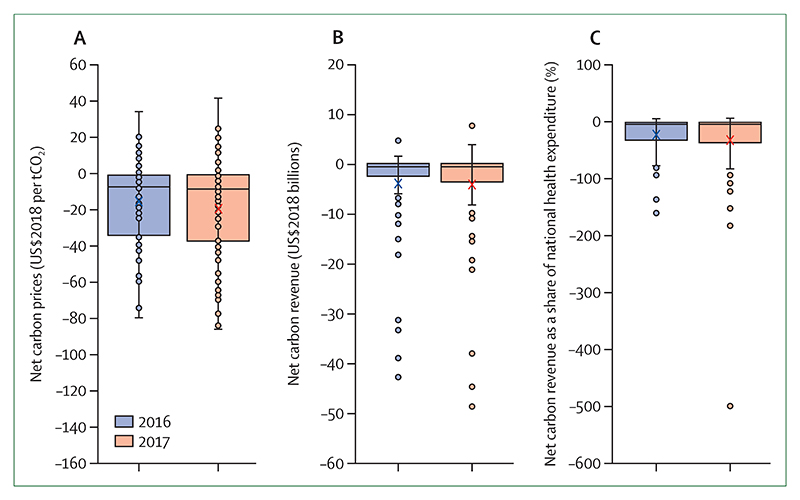
Figure 25. Net carbon prices, net carbon revenues, and net carbon revenue as a share of current national health expenditure across 75 countries in 2016 and 2017.
(A) Net carbon prices. (B) Net carbon revenues. (C) Net carbon revenue as a share of current national health expenditure. The boxes represent the IQRs, the horizontal lines inside the boxes represent the medians, and the crosses represent the means. The brackets represent the range from minimum to maximum; however, points are represented as outliers beyond this range if their values are 1·5 times the IQR less than the first quartile or more than the third quartile. tC02=tonnes of carbon dioxide.

