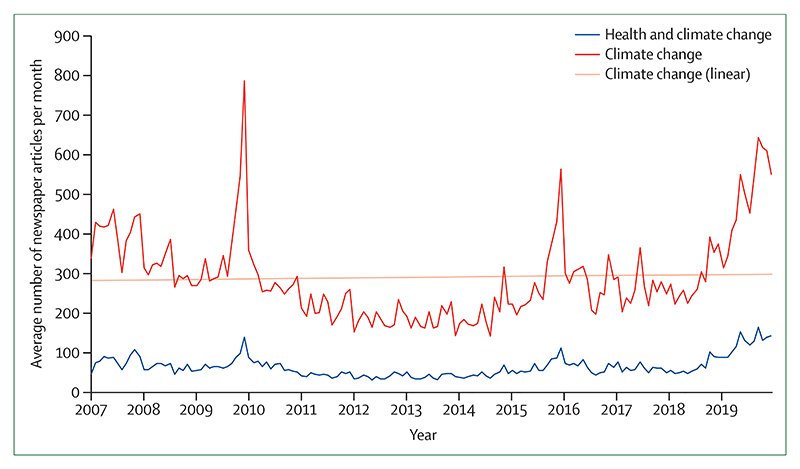
Figure 26. Average monthly coverage of climate change, and health and climate change combined, in 61 newspapers from 36 countries, 2007–19.
The non-linear lines represent the average monthly coverage of climate change and health and climate change only across the 61 newspapers. The linear line represents the linear trend of the average number of climate change articles per month between 2007 and 2019.

