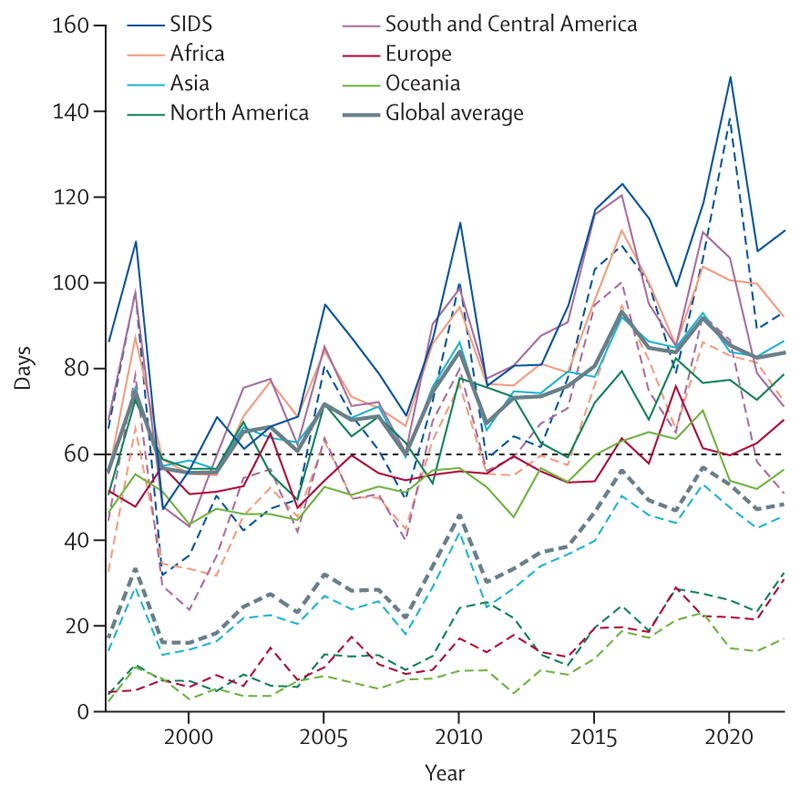
Figure 2. Population-weighted days of exposure to temperatures above the 84th percentile for 1986–2005.
In a climate with no anthropogenic climate change, this value would be expected to be close to 60 days (dashed black line). The number of days of exposure to warm temperatures for different regions are displayed as solid lines; the heavy solid line is the global average. The number of days of exposure to warm temperatures made at least twice as probable due to climate change are plotted as dashed lines; the heavy dotted line is the global average. SIDS=Small Island Developing States.

