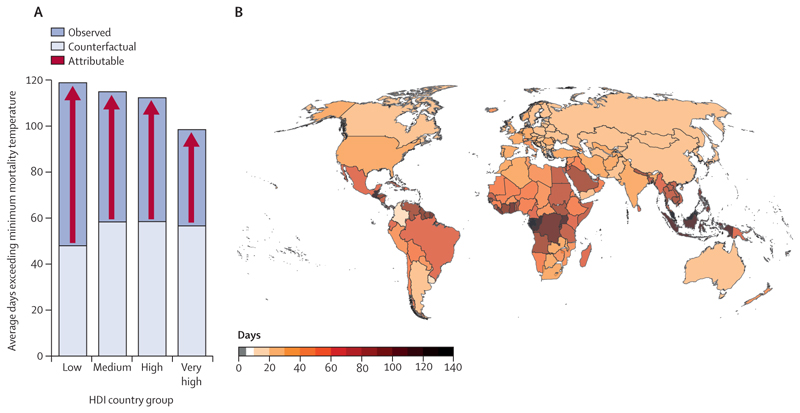
Figure 2. Days of health-threatening temperature in 2019–23.
(A) Stressful heat days in 2019–23, by HDI category. The darker blue indicates observed total stressful heat days, and the lighter blue indicates the number of stressful heat days that would have been expected without human-caused warming. Red arrows indicate heat days attributable to climate change. (B) Average number of days with health-threatening temperature attributable to climate change in 2019–23, by country. HDI=Human Development Index.

