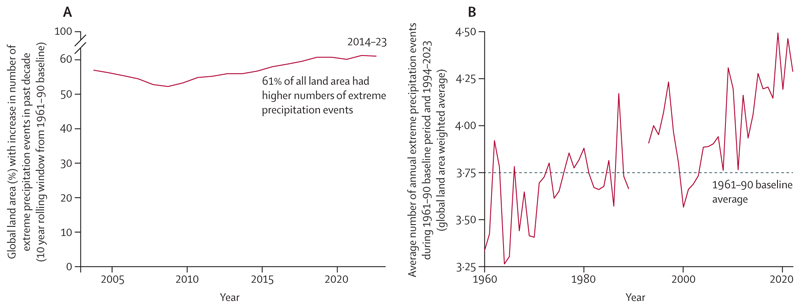
Figure 3. Extreme precipitation events over time.
Extreme precipitation events are defined as those exceeding the 99th percentile of daily precipitation during the baseline period of 1961–90. (A) Percentage of global land area where the number of extreme precipitation events increased during the previous decade. The red line depicts rolling 10-year averages—ie, the point above the year 2023 represents the percentage of global land cover where the average number of extreme precipitation events observed during the most recent decade (2014–23) exceeded the decadal average during the baseline period (1961–90). (B) Average number of annual extreme precipitation events per 79 km2 average land area in baseline years (1961–90) and during the most recent 30-year period (1994–2023).

