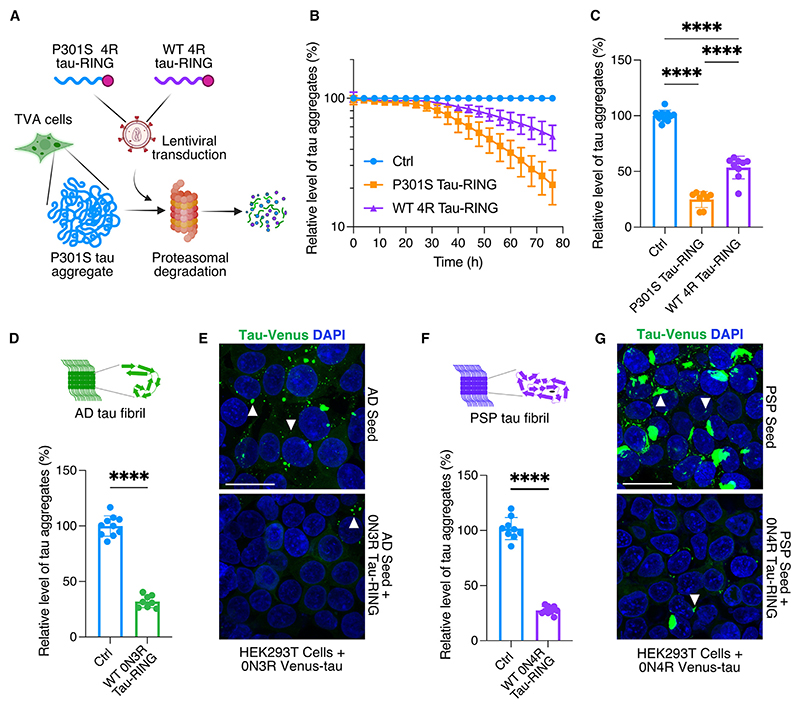
Figure 3. RING-Bait is effective against human brain-derived tau aggregates.
(A) Schematic of the TVA cell assay, with a lentivirus used to express different isoforms of tau-RING as examples of different “Baits.” Incorporation of the Bait into the aggregate leads to proteasomal degradation and a reduction in the number of puncta by high-content microscopy.
(B) Time course of TVA assay, where lentivirus carrying P301S 0N4R tau-RING or WT 0N4R tau-RING is applied to cells. N = 3.
(C) Quantification of the number of aggregates in TVA cells treated as in (B) 72 h post transduction. N = 3.
(D) Quantification of the number of aggregates in HEK293T cells expressing venus-3R tau, seeded with AD-derived tau aggregates, ±0N3R tau-RING. N = 3.
(E) Representative images from cells treated as in (D).
(F) Quantification of the number of aggregates in HEK293T cells expressing venus-4R tau, seeded with PSP-derived tau aggregates, ±0N4R tau-RING. N = 3.
(G) Representative images from cells treated as in (F). White arrows denote tau aggregates. Scale bars, 25 μm. Statistical significance for (C) determined by one-way ANOVA and Tukey’s multiple comparisons test. Statistical significance for (D) and (F) determined by unpaired t test. ****p < 0.0001.

