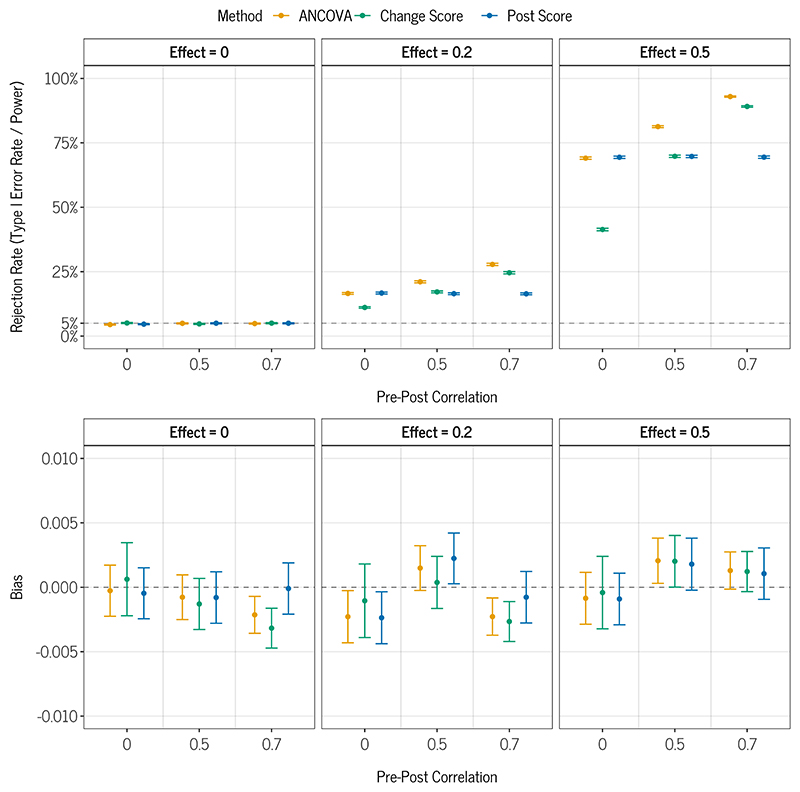
Figure 4. Estimated rejection rate (Power / Type I Error depending on DGM) and Bias of ANCOVA, Change Score Analysis and Post Score Analysis.
Note. Error bars correspond to ±1 Monte Carlo standard error. The y-axis in the bias plot is scaled only from −0.01 to 0.01, meaning that the bias can be considered negligible.

