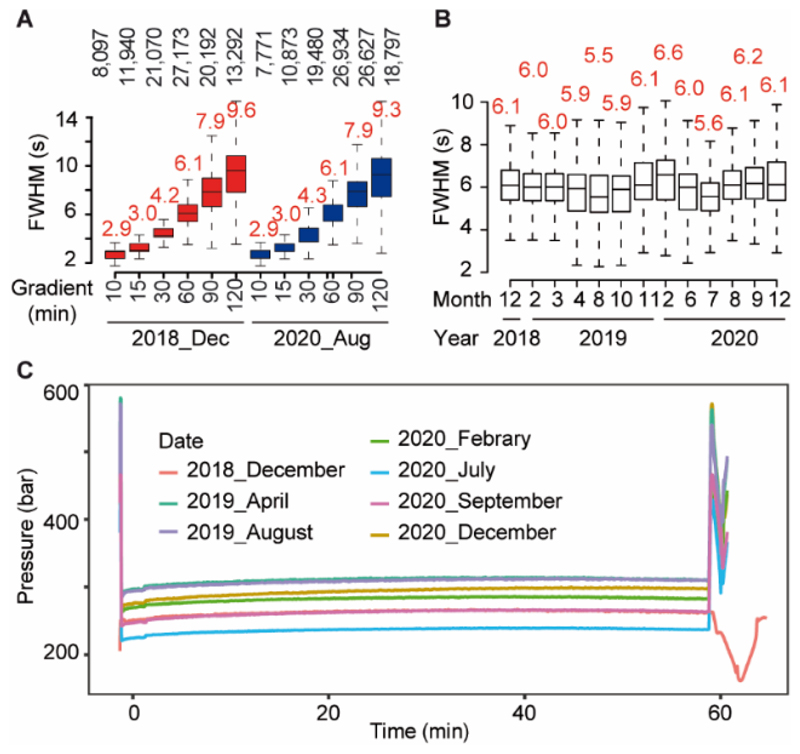
Figure 3. Chromatographic stability of the same PepMap column over a 20 months interval.
(A) Boxplots showing the chromatographic peak width (full width at half-maximum; FWHM) distributions of Hela peptides separated on the same PepMap column with different gradients in 2018 (red) and 2020 (blue; Orbitrap HF-X). (B) Boxplots showing the chromatographic peak width (full width at half-maximum; FWHM) distributions of Hela peptides separated on the same column using 60 min gradient between 2018 to 2020. Boxes cover 50% and whiskers represent 1.5 times the interquartile range of the data. (C) Overlaid pressure curves of Hela peptides separated on the same column between 2018 to 2020 using a 60 min gradient.

