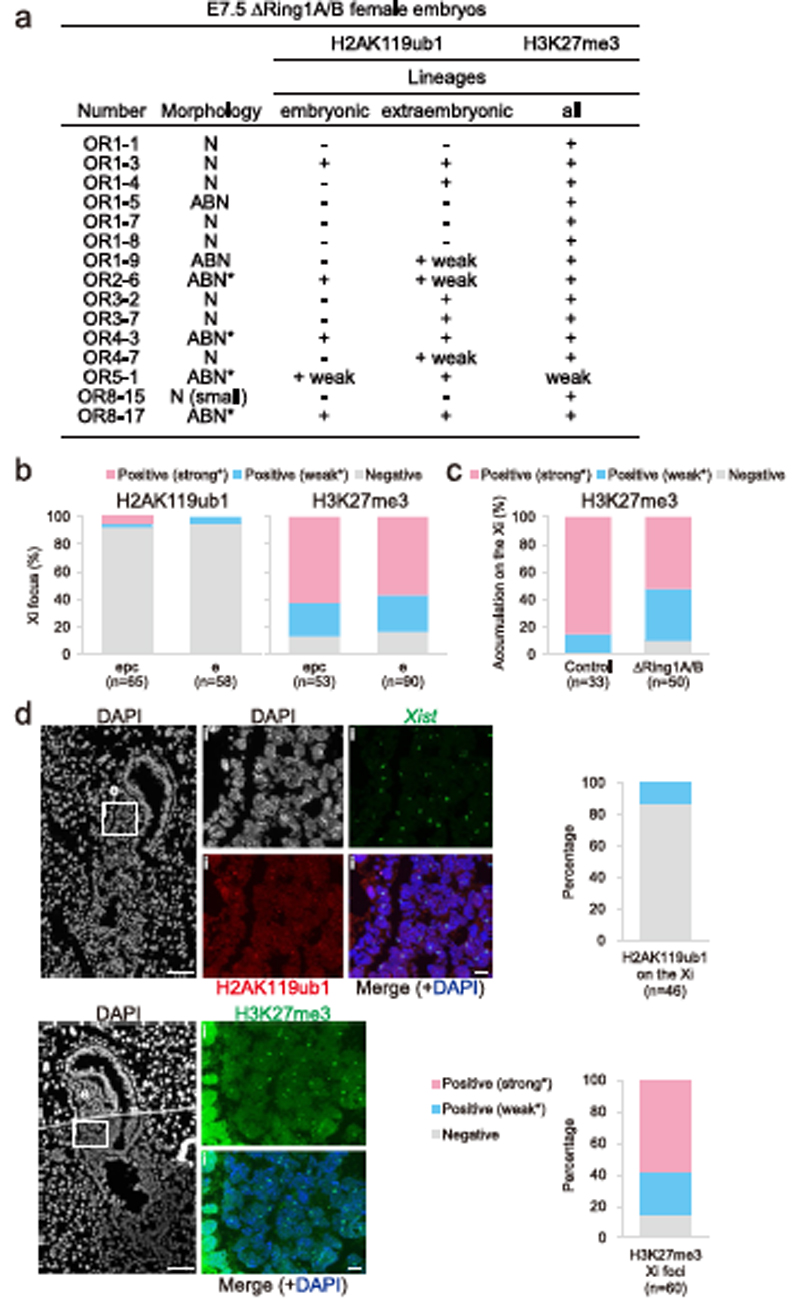
Extended Data Fig. 1. Replicates of E7.5 ΔRing1A/B female embryos.
a Features of all fifteen E7.5 ΔRing1A/B female embryos. Morphologies of embryos: N: normal, ABN: abnormal E7.5 morphology or (*) small E6.5-like morphology. H2AK119ub1 accumulation status on the Xi for embryonic and/or extraembryonic lineages. H3K27me3 accumulation status on the Xi for all lineages: embryonic and extraembryonic. 15 out of 27 female embryos were ΔRing1A/B among 68 embryos analysed. b, Quantification of H2AK119ub1 and H3K27me3 Xi focus expression in nuclei from sections in Fig. 1b (upper part). Both embryo (e) and ectoplacental cone (epc) nuclei from ΔRing1A/B E7.5 (OR1-1) embryos are analysed as positive (strong* or weak* expression as an Xi focus) or negative. Percentage and number of cells analysed are given for both histone marks. c, Quantification of H3K27me3 Xi accumulation in nuclei from sections in Fig. 1b (lower part). Results are given for control and ΔRing1A/B E7.5 female embryo (OR3-2). All nuclei are analysed as positive (strong* or weak* expression as an Xi focus) or negative. Percentage and number of cells analysed are given. d, Another example of ΔRing1A/B E7.5 female embryo (OR1–9) showing lack of H2AK119ub1 and presence of H3K27me3 on the Xi on sections. Upper part: General view of the embryo with DAPI staining is shown on the left. i: higher magnification of embryonic region (e) analyzed by immuno-RNA FISH for H2AK119ub1 and Xist. Quantification of H2AK119ub1 Xi accumulation in nuclei from the represented section. Lower part: Consecutive section. General view of the whole embryo with DAPI staining is shown on the left. i: higher magnification of embryonic region (e) immunostained for H3K27me3. Note; because the DAPI image of this cryosection was accidently lost, a consecutive section was DAPI stained and displayed here. Quantification of H3K27me3 Xi foci expression in nuclei from the represented section. All nuclei are analysed as positive (strong* or weak* expression as an Xi focus) or negative. Percentage and number of cells analysed are given for both histone marks. Scale bars: 100 μm for the whole embryo and 10 μm for the enlarged images indicated with white rectangles.

