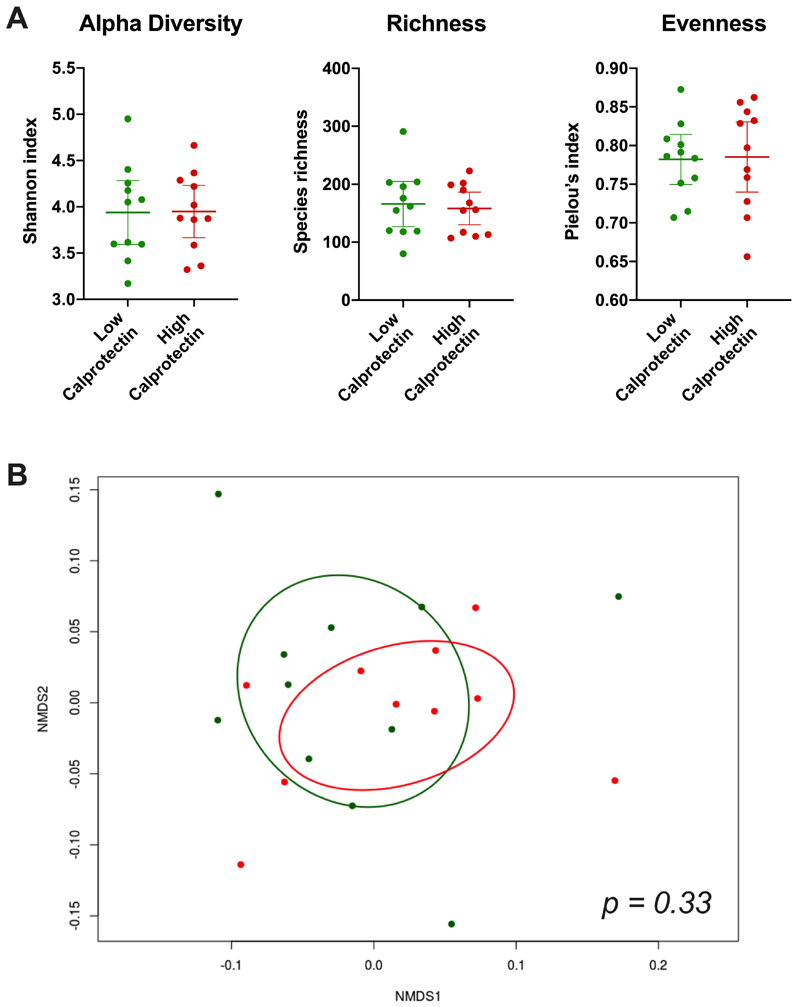
Figure 1. Comparison of microbial diversity metrics and community composition between high and low calprotectin groups.
A) Scatter plots with mean and 95% confidence interval for alpha diversity (Shannon index), species richness, and evenness (Pielou’s index). B) Non-metric multidimensional scaling (NMDS) plot of weighted UniFrac distance with 95% confidence ellipses. Red dots and ellipse = high calprotectin, green dots and ellipse = low calprotectin. P value calculated using PERMANOVA.

