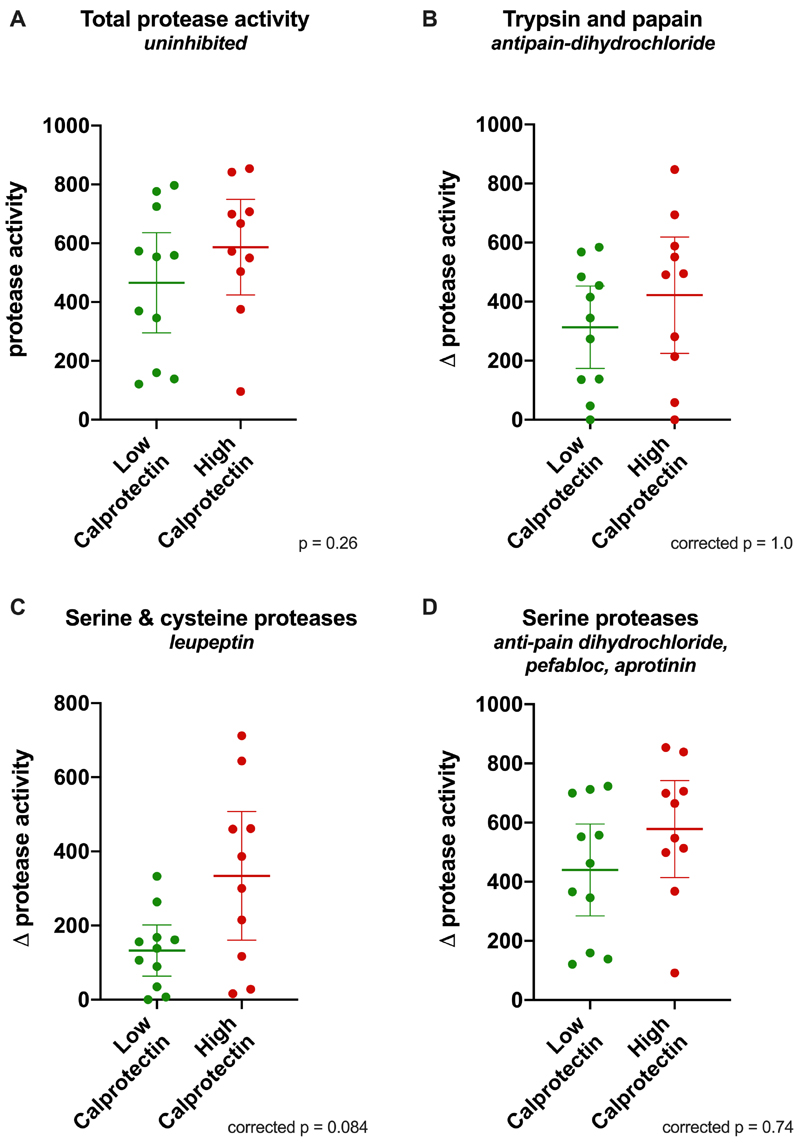
Figure 3. Scatter plots of protease activity (expressed as equivalent concentration of trypsin in μg/ml) in patients with high and low calprotectin.
Bars indicate mean and 95% confidence interval. Unpaired t test was performed for all samples, Bonferroni correction was applied for protease subtype activity. A: total protease activity (uninhibited). B-D: protease subtype activity, expressed as reduction in protease activity caused by addition of inhibitors (Δ protease activity); anti-pain dihydrochloride (B); leupeptin (C); anti-pain dihydrochloride, pepstatin, aprotinin (D).

