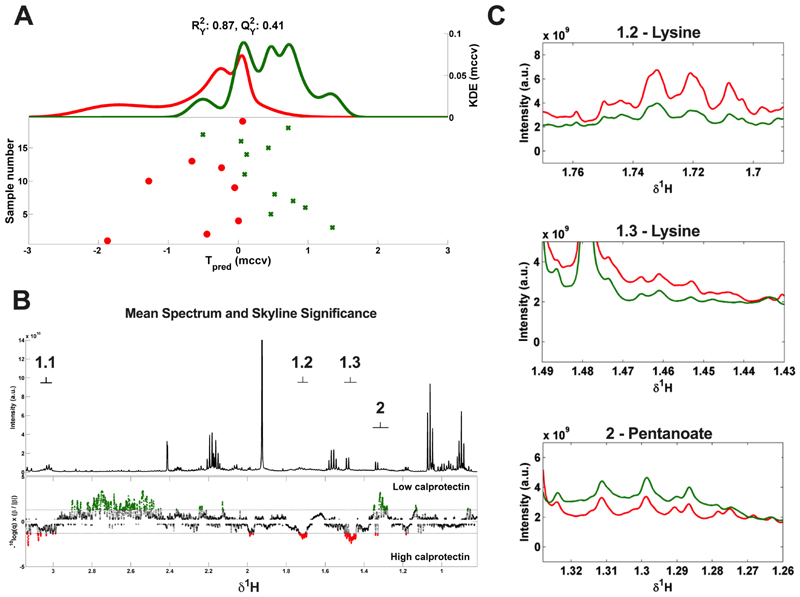
Figure 4.
(A) MCCV-PLS-DA score plot derived from 1D 1H-NMR spectra of faecal water samples, indicating the differentiation between high calprotectin group (red) and low calprotectin group (green). The model is comprised of Kernel Density Estimate (KDE) of the predicted scores (Tpred) for both groups. Dots represent the metabolic profile of each patient from the study cohort when its corresponding NMR spectrum and calprotectin values were available (n=19). The fit and predictability of the model were obtained and expressed as R2Y (explained variance) and Q2Y (capability of prediction) values. (B) MCCV–PLS-DA loading plot. Top depicts the average 1D 1H-NMR spectrum of the 19 faecal water samples. The bottom depicts the Manhattan plot showing -log10(q) × sign of regression coefficient (β) of the MCCV–PLS-DA model that in conjunction represent the contribution of each variable on it. In green, metabolites are shown that are significantly higher in the low calprotectin group, and in red metabolites significantly higher in the high calprotectin group. Labels: 1.1-1.3 = lysine (1.73(m), 1.46(m), 3.04 (t)), 2 = pentanoate/valerate (1.30(m)). (C) Fragments from the average 1D 1H-NMR spectra from the high calprotectin (red, n = 8) and low calprotectin (green, n = 11) groups, showing the less overlapped resonances detected as significant in the MCCV-PLS-DA model corresponding to lysine (1.2, 1.73(m), 1.3, 1.46(m)) and pentanoate/valerate (2, 1.30(m)). MCCV = Monte Carlo Cross-Validation. PLS-DA = Partial Least Squares Discriminant Analysis.

