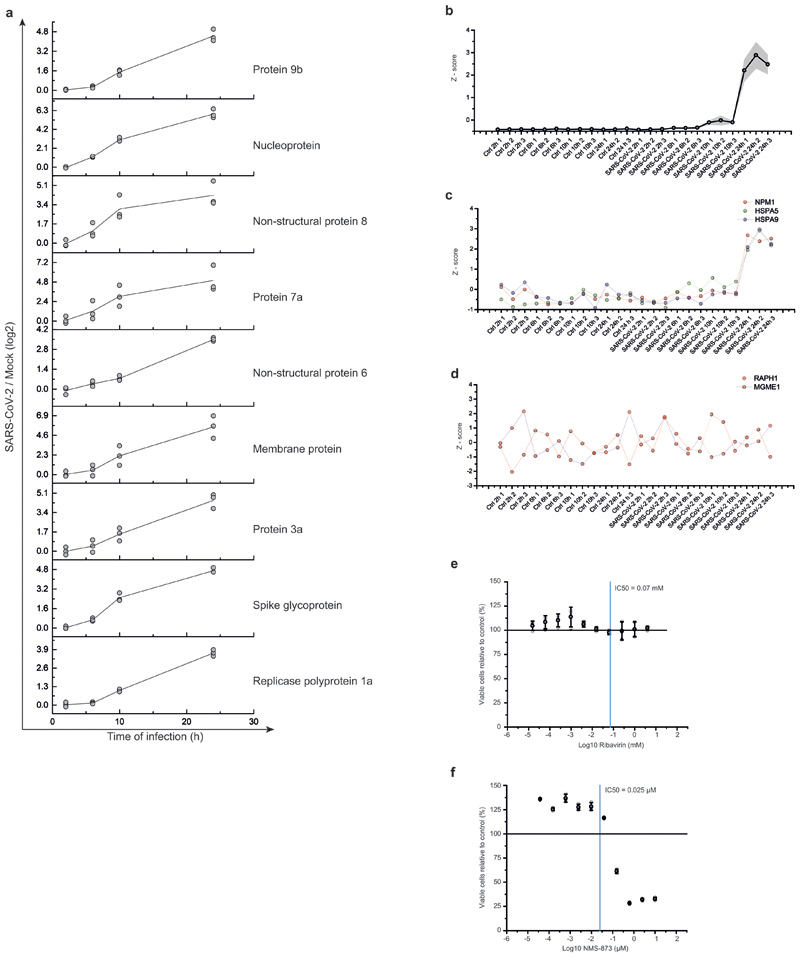
Extended Data Fig. 7. Viral protein profiles and cytotoxicity assay for nucleic acid and p97 inhibitors.
a, Total protein profiles for each viral protein with individual replicate measurements to indicate variation. Log2 ratios of infected versus mock cells are plotted against time of infection. Line indicates averaged curve (n = 3 independent biological samples) and dots represent individual measurements. b, Averaged reference profile of total protein levels for all viral proteins from a(9 viral proteins). Shade indicates s.d.. c, Example profiles of three proteins (NPM1, HSPA5 and HSPA9) significantly following the viral reference profile. d, Example profiles of proteins (RAPH1, MGME1) not following the viral reference profile. e, f, Cytotoxicity assays for different concentrations of Ribavirin (e) and NSM-873 (f) relative to control. Mean values ± s.d. are plotted (n = 3 independent biological samples). Line represents 100% viable cells.

