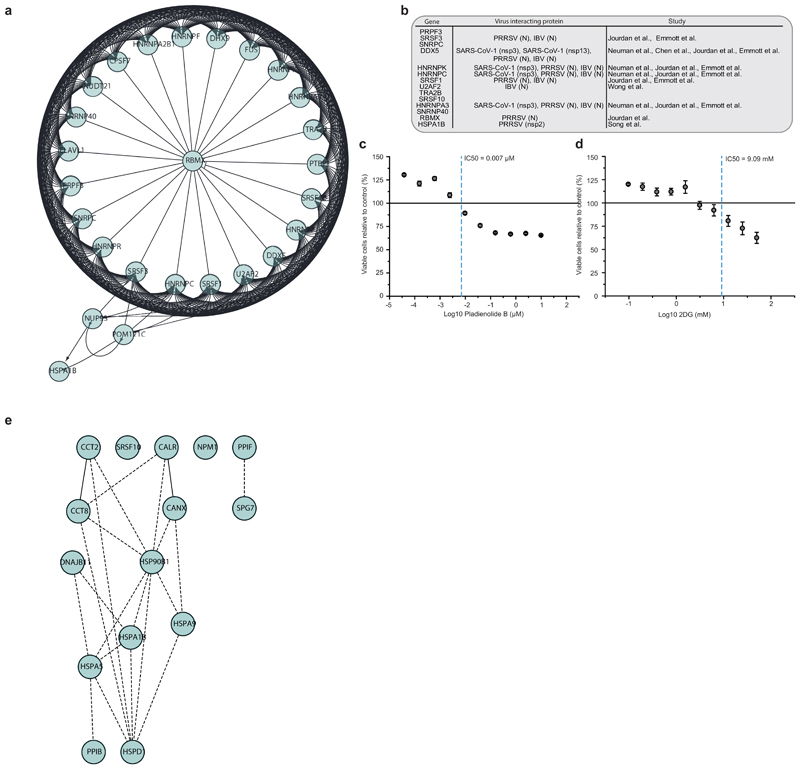
Extended Data Fig. 5. Networks of proteins increased during infection.
a, Network of proteins increased during infection with spliceosome annotation in Reactome pathway analysis. Lines indicate functional interaction. b, Table summarising viral proteins (from different coronaviruses) interacting with various spliceosome components. c, d, Cytotoxicity assays for different concentrations of Pladienolide B (c) and 2-deoxy-glucose (d) relative to control. Mean values ± s.d. (n = 3 independent biological samples). Line represents 100% viable cells. e, Protein network showing increased proteins during infection with annotation to “unfolded protein binding” molecular function. Lines indicate functional interaction

