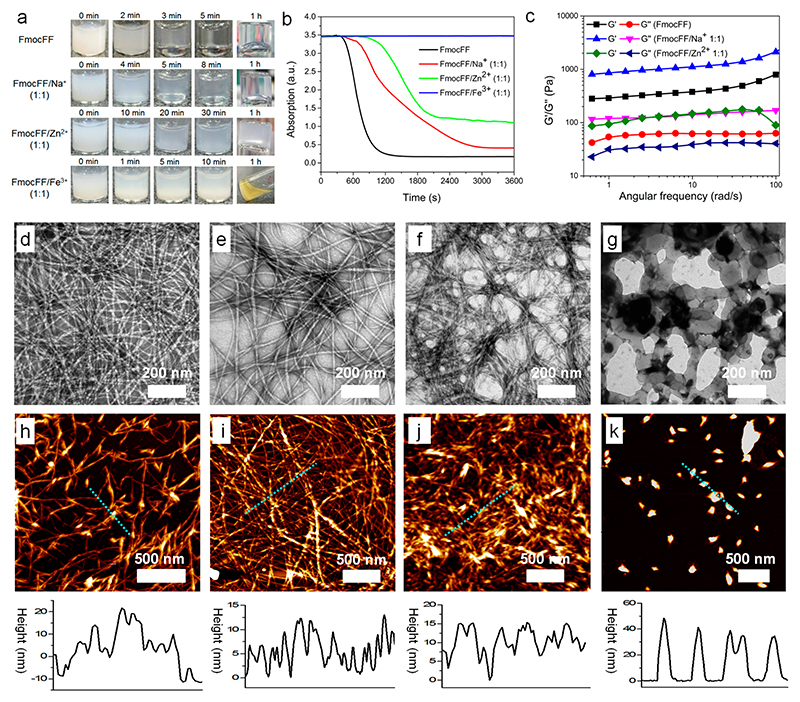
Figure 2.
(a) Time lapse optical images of FmocFF, FmocFF/Na+ (1:1), FmocFF/Zn2+ (1:1), and FmocFF/Fe3+ (1:1) in 2% DMSO in H2O (v/v) at a concentration of 2 mg/mL. 0 min represents the starting point after addition of FmocFF into the different metal ion soultions. (b) Turbidity measured at 405 nm over 3600 s for FmocFF, FmocFF/Na+ (1:1), FmocFF/Zn2+ (1:1), and FmocFF/Fe3+ (1:1) solutions in 2% DMSO in H2O (v/v). (c) Dynamic frequency sweep of gels of FmocFF, FmocFF/Na+ (1:1), and FmocFF/Zn2+ (1:1) at a strain of 0.1% over a range of 0.1–100 rads–1. (d–g) TEM images of (d) FmocFF, (e) FmocFF/Na+ (1:1), (f) FmocFF/Zn2+ (1:1), and (g) FmocFF/Fe3+ (1:1) in 2% DMSO in H2O (v/v). Scale bar is 200 nm. (h–k) AFM images (top) and height distribution (bottom) of (h) FmocFF, (i) FmocFF/Na+ (1:1), (j) FmocFF/Zn2+ (1:1), and (k) FmocFF/Fe3+ (1:1) in 2% DMSO in H2O (v/v). Scale bar is 500 nm.

