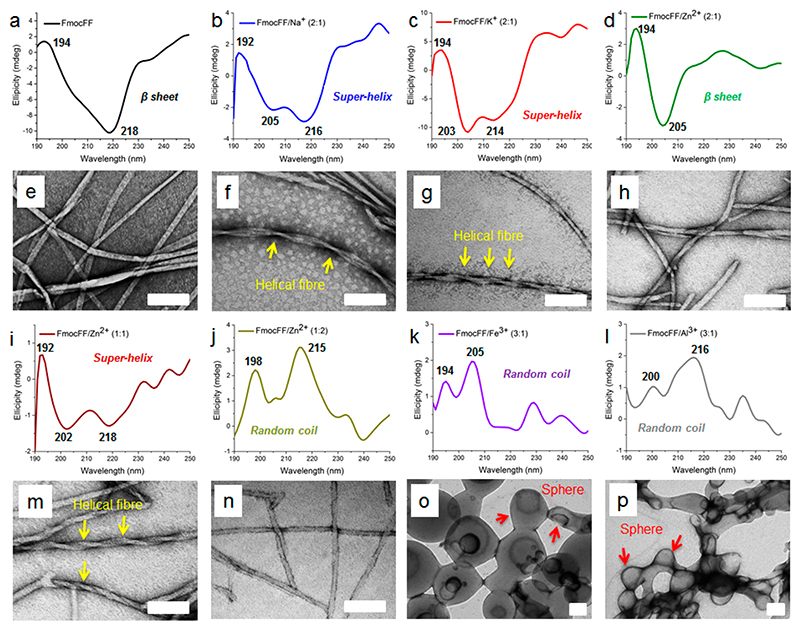
Figure 3.
(a–d, i–l) CD spectra and (e–h, m–p) high-resolution TEM images of FmocFF with different metal ions in 2% DMSO in H2O (v/v) at a concentration of 2 mg/mL. (a, e) FmocFF, (b, f) FmocFF/Na+ (2:1), (c, g) FmocFF/K+ (2:1), (d, h) FmocFF/Zn2+ (2:1), (i, m) FmocFF/Zn2+ (1:1), (j, n) FmocFF/Zn2+ (1:2), (k, o) FmocFF/Fe3+ (3:1), and (l, p) FmocFF/Al3+ (3:1). Scale bar is 50 nm.

