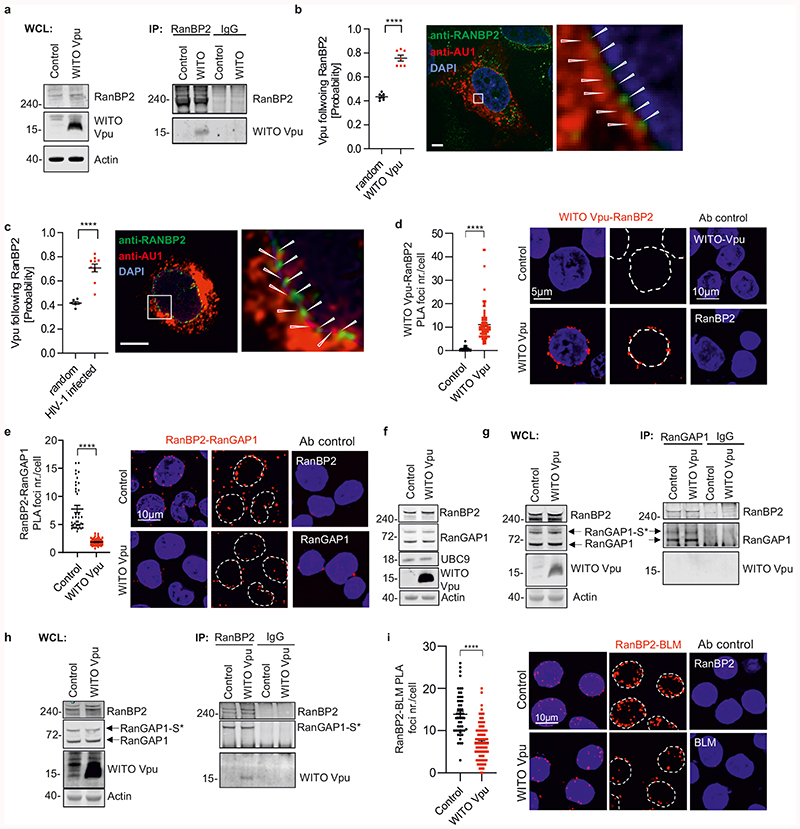
Fig. 5. Interaction of Vpu with RanBP2/RanGAP1*SUMO1/Ubc9 SUMO E3-ligase complexes.
a, Co-immunoprecipitation of WITO Vpu by RanBP2. WTK1(HR/3’) cells were transfected with WITO Vpu, lysed and RanBP2 was pulled down. b, Confocal microscopic localization analysis of WITO Vpu and RanBP2. SaOS cells were transduced with an HIV-1-NL4-3 construct expressing the AU1-tagged WITO Vpu and lacking the overlap between vpu and env genes. The graph on the left presents the evaluation of the probability of Vpu following RanBP2 calculated from the images such as obtained on the right, n=7, bars represent means ± SEM ****p<0.0001; size bar 5 μm. c, Primary CD4+ T cells were infected with an NL4-3 construct lacking the vpu and env overlap and expressing WITO-AU1. Cells were fixed, were treated as in b. The graph on the left presents the evaluation of the probability of Vpu following RanBP2 calculated as in b, bars represent means ± SEM, n=10. d, PLA assays of WITO Vpu and RanBP2. The assay was performed in WTK1(HR/3’) cells transfected with WITO Vpu-AU1 expression plasmid or empty control. Cells were stained using antibodies against AU1 and RanBP2 plus respective PLA probes. Dot plot presents raw foci values and bars represent means ±SEM derived from two independent experiments (Control n=39, WITO n=90), ****p<0.0001. Right, representative microscopic images. e, RanBP2 and RanGAP1 PLA proximity evaluation in WTK1(HR/3’) cells. Cells transfected as in 5d. Left, evaluation of RanBP2-RanGAP1 PLA foci per cell from 3 independent experiments (Control n=39, WITO n=61), bars represent means ± SEM, ****p<0.0001. Right, representative microscopic images. f, Western blot presenting levels of RanBP2, RanGAP1, UBC9 and WITO-AU1 in WTK1(HR/3’) cells transfected with WITO Vpu-AU1 or empty control. g-h, Immunoprecipitation of RanBP2 or RanGAP1 in WTK1(HR/3’) cells transfected with WITO Vpu-AU1. Cells were lysed and samples incubated with magnetic beads pre-incubated with the designated antibodies overnight. WB Experiments from f-h performed 2 times with similar outcome. i, Proximity analysis between RanBP2 and BLM. WTK1(HR/3’) cells were treated as in panel d. Left, evaluation of RanBP2-BLM PLA foci per cell from 3 independent experiments where in each experiment 50 cells were analyzed. Bars represent means ± SEM, ****p<0.0001. Right, representative microscopic images. Two sided unpaired t- test in b, c. Two sided Wilcoxon matched-pairs test in d, e,i.

