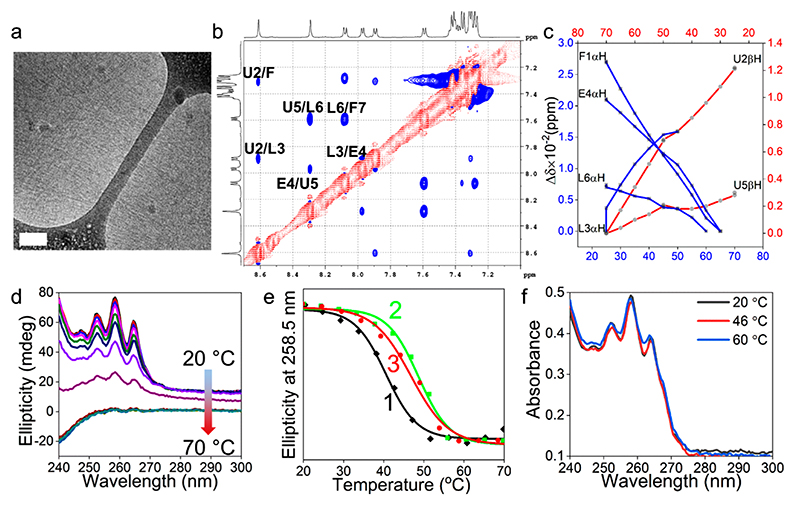
Figure 3. CCSHR self-assembly and folding.
(a) Cryo-TEM image of the nanofibers (scale bar 100 nm). (b) NH region ROESY spectrum showing sequential dNN connectivity typical of a helical secondary structure (one letter notation of the amino acids: Phe, F; Aib, U; Leu, L; Glu, E. Residues are numbered in ascending order from N- to C-terminus). (c) Plot of chemical shift variations against temperature for α- and β-protons. (d) Temperature-dependent CD spectra. (e) Thermal unfolding profiles at different peptide concentrations. [(1) Tm = 40 °C (5 mg mL−1); (2) Tm = 48 °C (7 mg mL−1); (3) Tm = 47 °C (8.5 mg mL−1)]. (f) Absorbance vs wavelength profile of nanofibers prepared at 7 mg mL−1 concentration at different temperatures.

