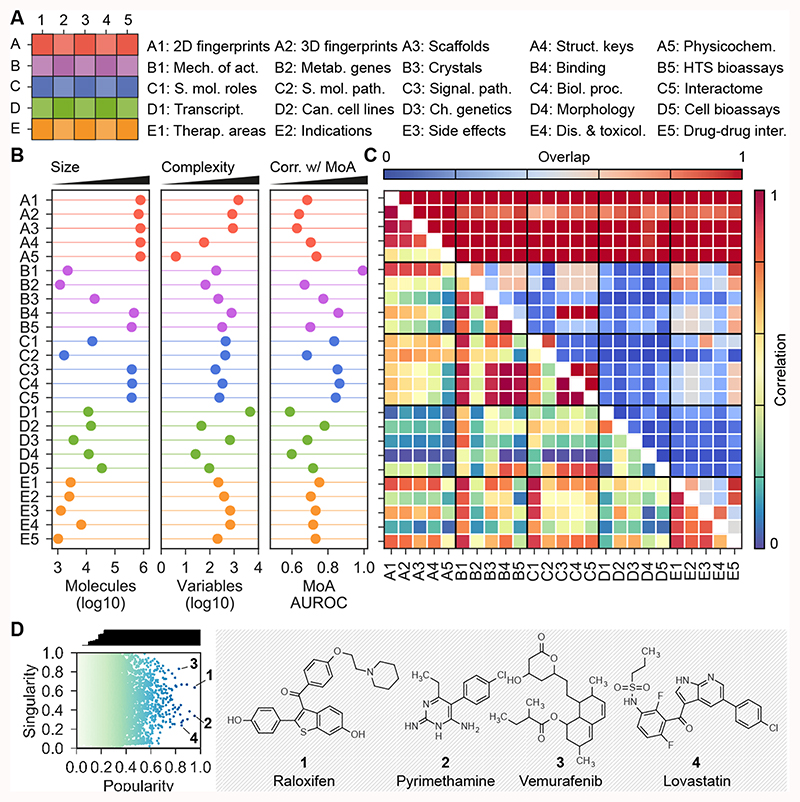
Figure 1. CC statistics.
(A) The organization of the 5x5 CC spaces. (B) Number of molecules (size), signature length (i.e. number of latent variables as a measure of data complexity) and AUROC performances when checking if similar molecules in each CC space tend to share mechanism of action. (C) Overlap between CC spaces, in terms of number of shared molecules (upper triangle) and correlation k between CC spaces (lower triangle). (D) Popularity and singularity of molecules. Popularity refers to the proportion of CC spaces in which the molecule is present (correcting for correlation between CC spaces), and singularity refers to the ‘uniqueness’ of the molecule. The larger the number of molecules showing similarity to a given molecule, the less singular the molecule is. Popular molecules within a wide range of singularities are highlighted. For example, raloxifen (1), pyrimethamine (2) and vemurafenib (3) have data in many CC spaces. Likewise, some molecules are more singular than other for which many analogs exist throughout the CC organization (e.g. lovastatin (4)).

