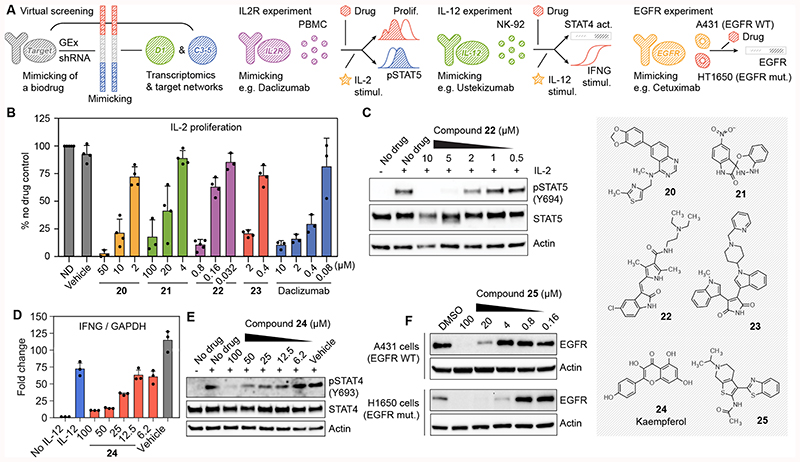
Figure 5. Discovery of chemical analogues of biologics.
(A) Scheme of the methodology. We look for compounds whose gene expression signatures (D1) would mimic gene expression signatures corresponding to the shRNA knock-down of the target of interest. In addition, we do a networks-level (C3-5) signature matching of the target profiles with those of the compounds. Candidates for IL-2 receptor, IL-12 and EGF receptor are tested in different experimental setups. (B) CD3/CD28 pre-stimulated PBMC were left without treatment for 3 days, labelled with CFSE and then stimulated with IL-2 (0.5 ng/mL) in the presence of the indicated compounds. Three days after stimulation, proliferation was measured by flow cytometry as CFSE label decay and normalized compared to the cells stimulated in the absence of drug (ND). Mean ± SD of 3-5 independent experiments are shown, as illustrated by the dots in each barplot. (C) IL-2-induced STAT5 phosphorylation in PBMC quantified western blot for compound 22. One representative experiment is shown (n=3) (D) NK-92 cells were stimulated with IL-12 (50 ng/mL) in the presence of the indicated concentration of compound 24 (kaempferol). IFNG mRNA levels after 6 hours were quantified by RT-PCR. Mean ± SD of 3 independent experiments are shown. (E) Phosphorylation of STAT4 at tyrosine 693 was assessed by western blot 1 h after stimulation with IL-12. Total STAT4 and actin antibodies were used as controls. One representative experiment is shown (n=3). (F) A431 and H1650 cells were treated for 24 hours with the indicated concentrations of compound 25 (APE1 inhibitor III). We quantified EGFR protein by western blot. Actin was used as a loading control. Representative blots out of three independent experiments are shown.

