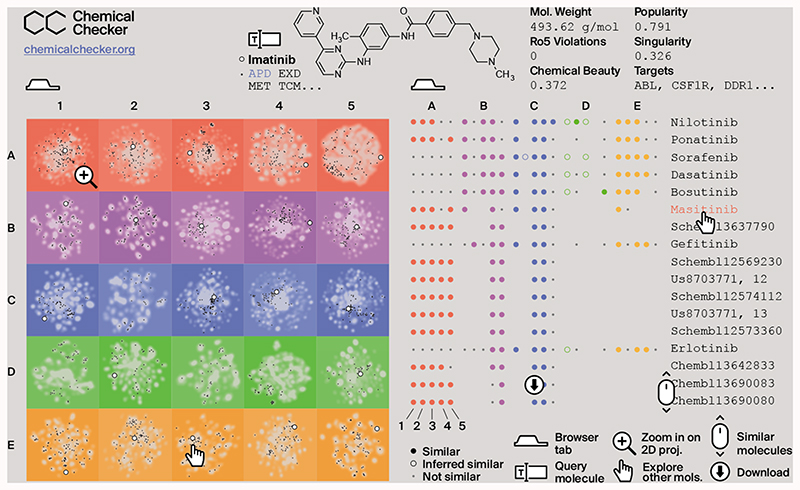
Figure 6. Representation of the CCweb resource.
The left tab (home page) is an interactive panel of 2D projections, where the query molecule (e.g. imatinib, white dot) can be compared to the CC background (in gray) and to other molecules of interest such as approved drugs (APD, in black). The right tab (exploration page) displays molecules that are similar to the query one. Similarities are measured across the 25 CC spaces (A1-E5).

