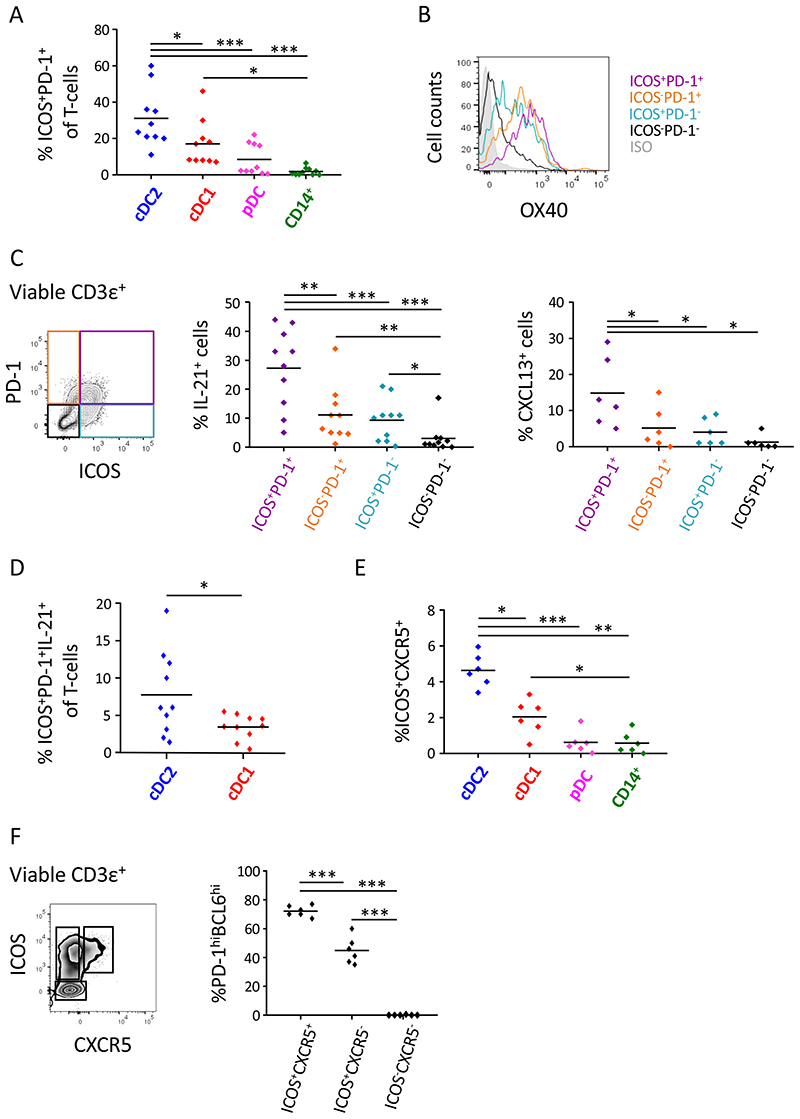
Figure 2. Lung cDC2 are the most potent inducers of Tfh-like cell polarization.
DC subsets were purified from non-obstructed peritumoral lung tissue and co-cultured with allogeneic naive blood CD4+ T-cells. (A) Percentages of ICOS+PD-1+ T-cells in the different DC/T-cell co-cultures were determined at d7 of the co-culture via flow cytometry. Summary data graph with each symbol representing an individual donor (n=10). (B) Flow cytometry histogram of OX40 staining on ICOS+PD-1+ (purple), ICOS−PD-1+ (orange), ICOS+PD-1− (blue) and ICOS− PD-1− (black) T-cell subsets in cDC2/T-cell co-cultures. Representative data from 3 donors is shown. (C) Intracellular IL-21 (n=10) and CXCL13 (n=6) staining of ICOS+PD-1+ (purple), ICOS−PD-1+ (orange), ICOS+PD-1− (blue) and ICOS−PD-1− (black) T-cell subsets in cDC2/T-cell co-cultures after restimulation with PMA and ionomycin in the presence of Golgi-plug and Golgi-stop. Summary data graph in which each symbol represents an individual donor. (D) Percentages of ICOS+PD-1+IL-21+ T-cells in cDC2/T-cell and cDC1/T-cell co-cultures were determined. Summary data graph in which each symbol represents an individual donor (n=10). (E) Proportions of ICOS+CXCR5+ T-cells in the different DC/T-cell co-cultures were determined at day 4. Summary data graph in which each symbol represents an individual donor (n=6). (F) Percentages of PD-1hiBCL6hi cells in ICOS+CXCR5+, ICOS+CXCR5− and ICOS− CXCR5− T-cell subsets in the cDC2/T-cell co-cultures were determined via flow cytometry. Summary data graph in which each symbol represents an individual donor (n=6). *p<0.05, **p<0.01, ***p<0.001, Tukey’s multiple comparison test (A, C, E and F) and paired student’s t-test (D).

