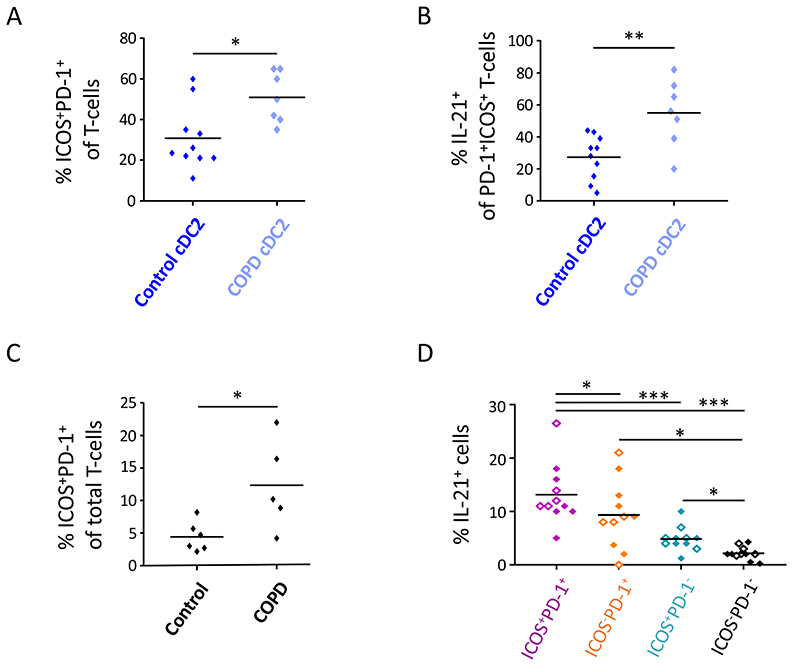
Figure 3. cDC2 from COPD GOLD II lungs display increased potential to promote Tfh-like cell skewing which is associated with the increased presence of Tfh-like cells in the COPD lung.
(A) and (B) cDC2 were isolated from COPD GOLD II peritumoral lung tissues (n=7) and co-cultured with allogeneic naïve CD4+ T-cells. Proportions of ICOS+PD-1+ T-cells (A) and ICOS+PD-1+IL-21+ T-cells (B) were determined at day 7 and compared to the respective T-cell proportions induced by cDC2 from non-obstructed peritumoral lung tissues as previously shown in Figure 2 (n=10). Shown is summary data graphs in which each symbol represents an individual donor. (C) Percentages of ICOS+PD-1+ Tfh-like cells were determined in peritumoral lung tissue resections of COPD and non-obstructed control subjects via flow cytometry. Shown is summary data graph in which each symbol represents an individual donor (n=6 for controls and n=5 for COPD subjects). (D) Intracellular IL-21 staining of lung tissue ICOS+PD-1+ (purple), ICOS−PD-1+ (orange), ICOS+PD-1− (blue) and ICOS−PD-1− (black) T-cell subsets after PMA/ionomycin restimulation (+ Golgi-plug/Golgi-stop) in DC-free in vitro cultures. Shown are pooled data from control (full diamonds) and COPD (open diamonds) lung resections (n=11). Each symbol represents an individual donor. *p<0.05, **p<0.01, ***p<0.001, Student’s t-test (A-C) and Tukey’s multiple comparison test (D).

