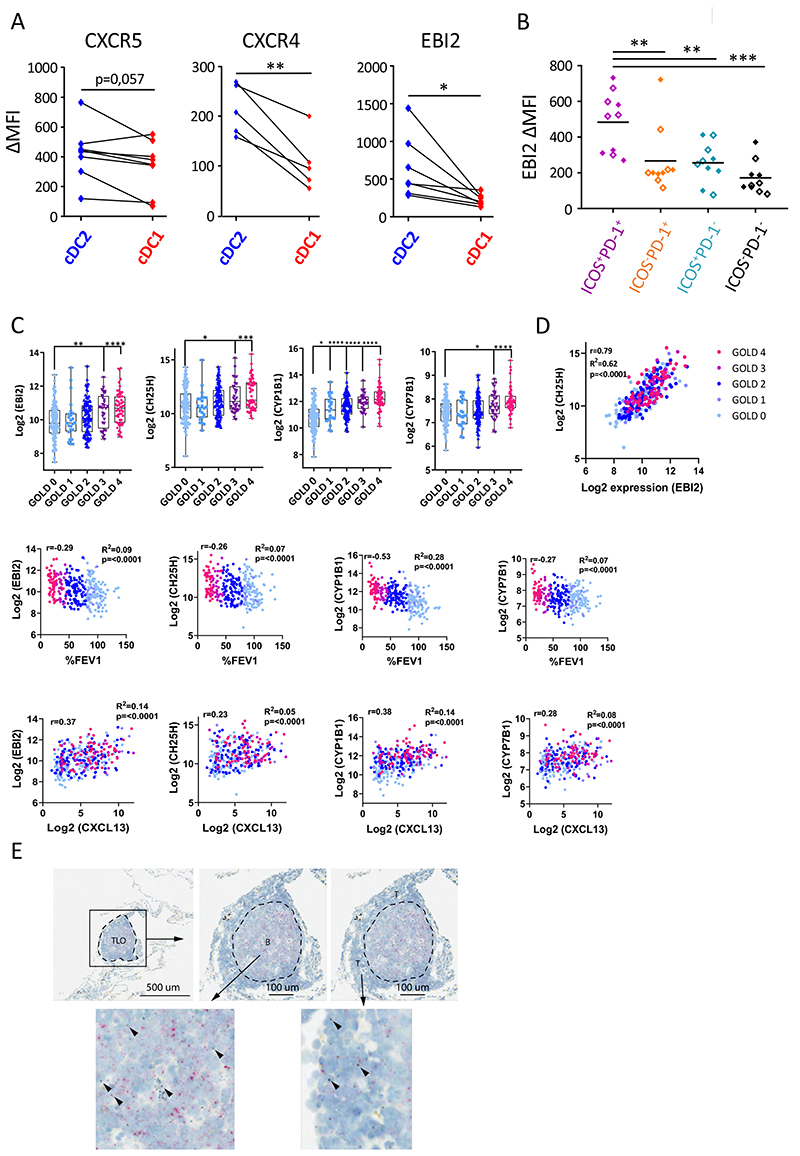
Figure 4. cDC2 exhibit a unique migratory pattern.
(A) Surface levels of CXCR5, CXCR4 and EBI2 were measured on cDC2 and cDC1 from non-obstructed peritumoral lung resections via flow cytometry (n=7 for CXCR5, n=5 for CXCR4 and n=7 for EBI2). Summary data graphs (mean MFI corrected for background intensity) for the indicated markers are shown. Each symbol represents an individual donor. (B) Surface EBI2 levels on ICOS+PD-1+ (purple), ICOS− PD-1+ (orange), ICOS+PD-1− (blue) and ICOS−PD-1− (black) T-cell subsets in the lung measured via flow cytometry. Summary data graph (mean MFI corrected for background intensity) of pooled control (full diamonds) and COPD (open diamonds) lung samples (n=10). Each symbol represents an individual donor. (C) Correlations of whole lung EBI2, CH25H, CYP1B1 and CYP7B1 mRNA expression with COPD disease severity (GOLD stage and %FEV1) and whole lung CXCL13 mRNA as a marker for TLO formation. (D) Correlation of whole lung CH25H mRNA expression with whole lung EBI2 mRNA expression. Data in C and D are derived from a publicly available GSE-set (GSE47460). Healthy control subjects n=116; GOLD I n=24; GOLD II n=97; GOLD III n=32 and GOLD IV n=54. (E) In situ visualization of CH25HmRNA (brown) in COPD GOLD IV explanted lung tissue TLOs via RNAscope duplex technology (n=5). CD19 mRNA (red) is used to delineate the B-cell follicle of the TLO. *p<0.05, **p<0.01, ***p<0.001, (A) Student’s t-test, (B) Tukey’s multiple comparison test (C) and Holm-Sidak’s multiple test correction was used. To test for correlation of expression for the indicated genes within all study subjects, linear regression analysis and Pearson’s correlation test were used to calculate the correlation coefficient r, R2 and p-value of correlation.

