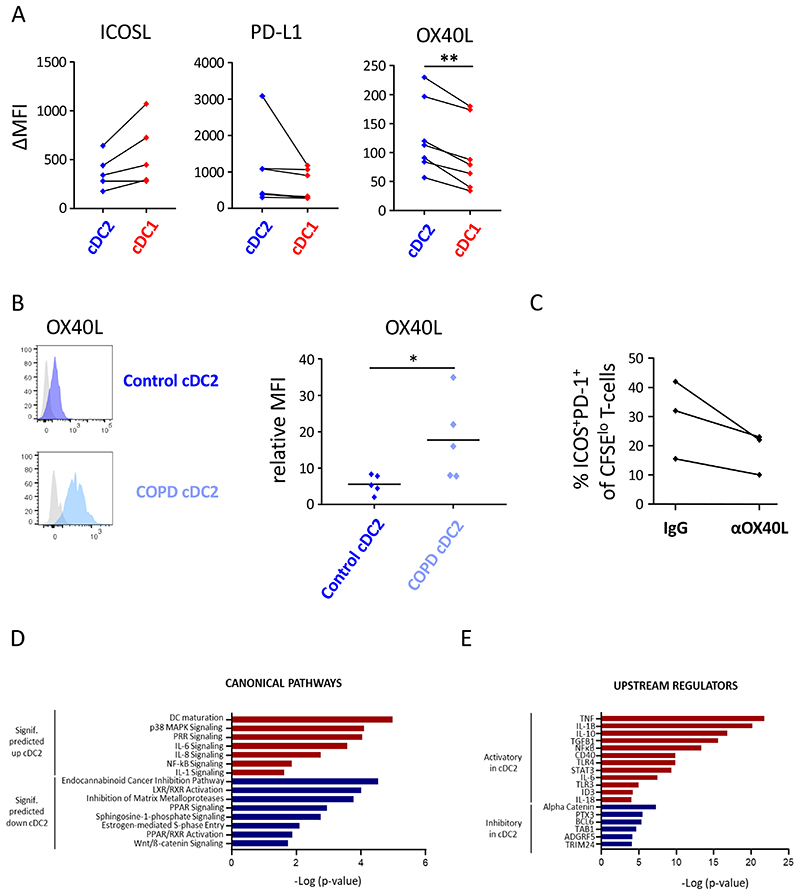
Figure 6. cDC2 express increased levels of OX40L and transcriptional signatures related to Tfh-cell priming.
Surface levels of ICOSL, PD-L1 and OX40L were measured on cDC2 and cDC1 from (A) non-obstructed and (B) COPD GOLDII (OX40L) peritumoral lung tissue via flow cytometry. Summary data graphs of the indicated co-stimulatory markers are depicted in A and representative flow cytometry histograms and summary data graph for OX40L is shown in B. Each symbol represents an individual donor (n=5 for ICOSL, n=6 for PD-L1, n=7 for control OX40L control and n=5 for COPD OX40L). *p<0.05, **p<0.01, Student’s t-test. (C) cDC2 were isolated from non-obstructed peritumoral lung resections (n=3) and co-cultured with allogeneic naïve CD4+ T-cells in the presence of an OX40L blocking antibody (oxelumab) or an IgG isotype control. Proportions of ICOS+PD-1+ T-cells were determined at day 7. Shown is the combined data graph in which each symbol represents an individual donor. (D) and (E) cDC2 and cDC1 were FACS-sorted from non-obstructed peritumoral lung resections (n=5) and the RNA transcriptomic profile of these subsets was generated via NGS. (D) Canonical pathways significantly (signif) upregulated (red) and downregulated (blue) (Fisher’s exact test, -log10 P values for each represented pathway are shown) in transcriptional signatures in cDC2 vs cDC1 as predicted by Ingenuity Pathway Analysis (IPA). (E) Significant putative regulators with predicted activating (red) or inhibitory (blue) influence on transcriptional signatures in cDC2 vs cDC1 from non-obstructed lungs, as determined by IPA.

