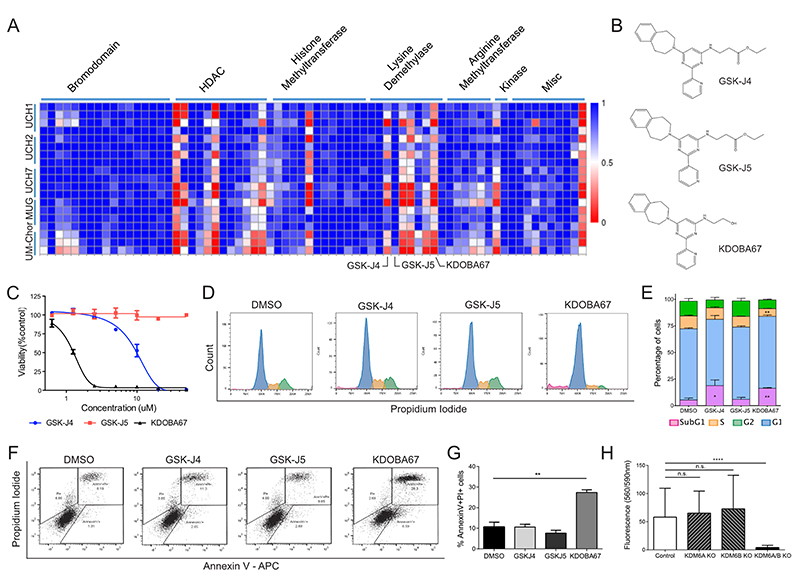
Figure 1. Focused epigenetic library screening identifies H3K27 lysine demethylases as potential therapeutic target in chordoma.
(A) Screening of 90 small molecule probes with validated activity against enzymes involved in chromatin biology on 5 chordoma cell lines. Each row represents a separate replicate and each column an individual compound. Columns have been grouped together by inhibitor class (c.f. also to Dataset S1). Values plotted as fractional viability compared to vehicle (DMSO) control. (B) Molecular structures of GSK-J4, GSK-J5 and KDOBA67. (C) Dose response curves for GSK-J4, GSK-J5 and KDOBA67 in UM-Chor. (D-G) Cell cycle changes (D-E) and cell death analysis assessed by AnnexinV-PI staining (F-G) in response to the compounds after 72 hours of treatment. Representative histogram/dot plots and quantification of 3 independent experiments, with 3 replicates per condition (c.f. also Figure S2). (H) Viability measured by Alamar blue of UCH1 following CRISPR/Cas9 editing of KDM6A/B or both. Mean of 2 independent experiments, with at least 6 replicates per condition per experiment. *p ≤0.05, **p ≤0.01, ***p ≤0.001, ****p ≤0.0001.

