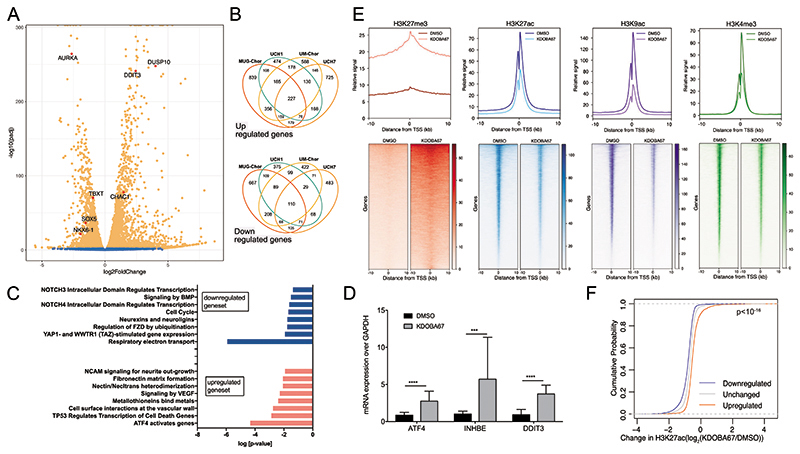
Figure 2. Epigenomic and transcriptomic profiling in response to H3K27 lysine demethylase inhibitors in chordoma cell lines.
(A) Volcano plot summarising differential expression in chordoma cells (UM-Chor) following treatment with KDOBA67 for 48 hours. Blue, not significant; Orange, adjusted P-value (Padj) <0.05. Average of 3 biological replicates. Results for UCH1, MUG-Chor and UCH7 in Figure S4 and Dataset S2. TBXT expression is reduced across chordoma cell lines (log2-fold changes -2.1 (MUG-Chor), -1.2 (UCH1), -0.96 (UM-Chor), -1.5 (UCH7) (Padj < 0.01)). (B) Venn diagrams showing the numbers of upregulated (top) and downregulated (bottom) genes in 4 chordoma cell lines; an average of 3 biological replicates per cell line. (C) Reactome analysis for UCH1, UCH7, UM-Chor and MUG-Chor in response to KDOBA67. (D) Upregulation of ATF4 and ATF4-target genes (inhibin subunit beta E, INHBE and DDIT3) in patient-derived primary chordoma cultures as assessed by qPCR (4 independent primary samples, at least 3 biological replicates per condition). (E) Metagene plots (top) and heatmaps (bottom) of ChIP-Rx peaks of H3K27me3, H3K27ac, H3K9ac and H3K4me3 in UCH1 cells treated with KDOBA67 or DMSO treatment for 48 hours. The signal represents the average of 2 or 3 biological replicates per condition. Principal component analysis (PCA) plots of single replicates is shown in Figure S4F, H-J. (F) Cumulative distribution frequency of the change in H3K27ac occupancy in UCH1 cells in response to KDOBA67 versus DMSO control as assessed by ChIP-Rx, at the promoter of genes which are upregulated, downregulated or unchanged in response to KDOBA67 as assessed by RNA-sequencing. The three distributions are statistically different one from another by Kolmogorov Smirnov test (p<10-16). *p ≤0.05, **p ≤0.01, ***p ≤0.001, ****p ≤0.0001.

