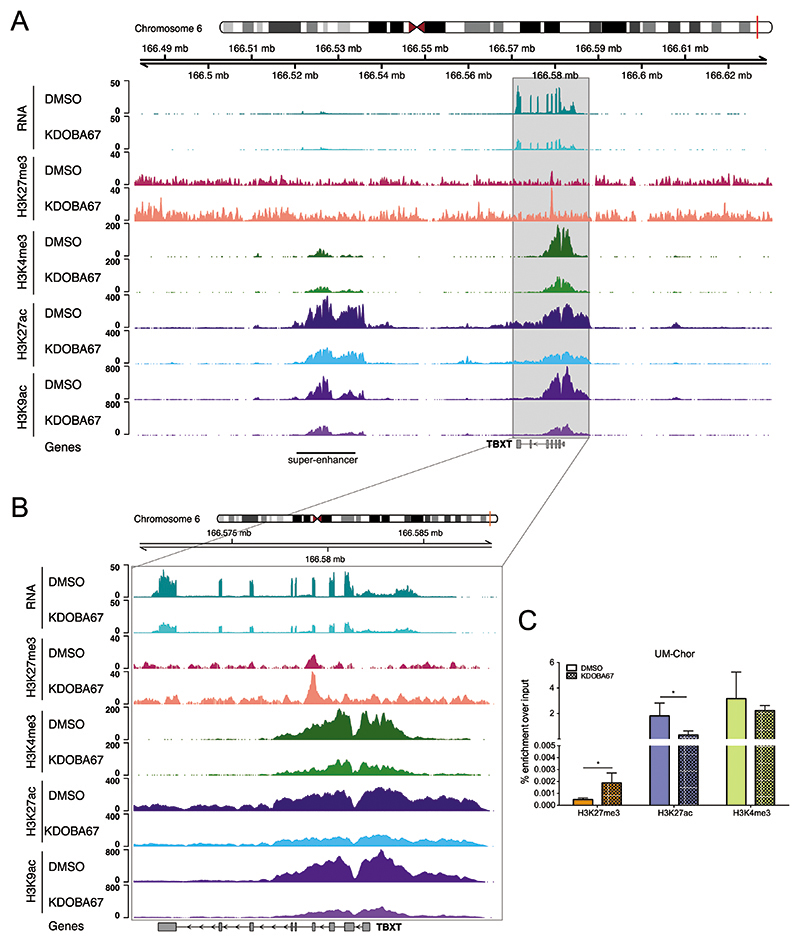
Figure 3. Inhibition of H3K27 lysine demethylase leads to chromatin changes around TBXT in chordoma.
(A) RNA expression (top pair of tracks), H3K27me3, H3K4me3, H3K27ac and H3K9ac modifications at the TBXT locus in UCH1 cells treated with KDOBA67 (light colours) or DMSO (dark colours) for 48 hours. An increase in the level of H3K27me3 over the gene locus is observed with a concurrent decrease in the levels of H3K27ac, H3K9ac and H3K4me3 at the TBXT promoter and super-enhancer (labelled). Tracks show the average of replicates. (B) As (A) but with an expanded view of the TBXT gene. (C) H3K27me3, H3K27ac and H3K4me3 enrichment at the TBXT promoter (-2Kb from the TSS) in UM-Chor cells treated with KDOBA67 or DMSO for 48hours, assessed by ChIP-qPCR. Results from 4 biological replicates per condition. ChIP-qPCR data for positive control sites are shown in Figure S4K-M.

