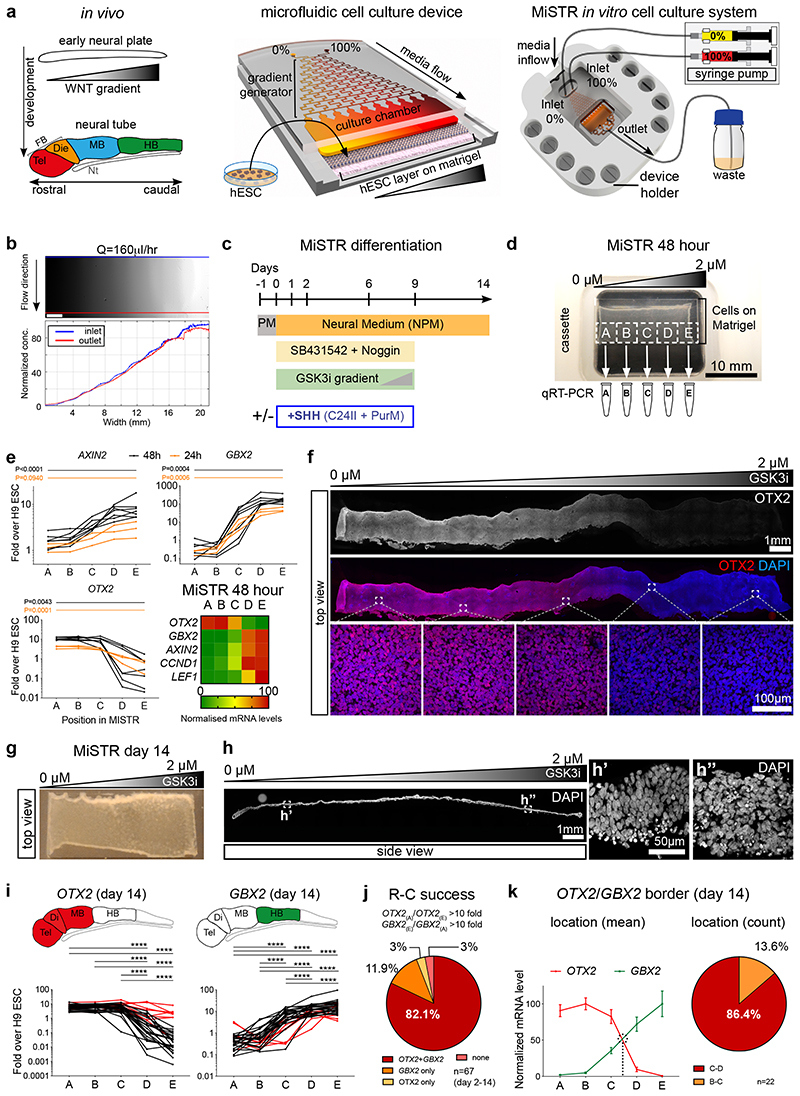
Figure 1. Design of the MiSTR cell culture system and establishment of a WNT signalling gradient in hESC-derived tissue.
(a) The in vivo WNT gradient at the early neural plate stage was mimicked in vitro by a microfluidic gradient generator producing sequential mixing of two media containing 0% and 100% morphogen. The media with the morphogen gradient flows laminarly from the microfluidic channels into the cell culture chamber containing a layer of hESCs seeded onto a bed of Matrigel. Media inflow is controlled by precision syringe pumps, while on the opposite side of cell chamber the used media outflows to a waste container. FB: Forebrain, Tel: telencephalon, Die: diencephalon, MB: midbrain, HB: hindbrain, Nt: Notochord.
(b) Fluorescein gradient (top view), measured across the whole width and length of the cell culture chamber at a flow rate of Q = 160 μl/h; blue line indicates inlet side measurements, and red line outlet side measurements. Scale bars, 2 mm.
(c) Overview of MiSTR differentiation protocol. Ventralising factors (+SHH) were added only when indicated. PM: Pluripotency Medium, PurM: Purmorphamine.
(d) Representative hESCs-derived tissue atop the Matrigel substrate after 48 hours of neural differentiation in the MiSTR device under a GSK3i gradient. The tissue was sub-dissected into 5 samples (A-E) for qRT-PCR analysis.
(e) qRT-PCR analysis along the 5 regions A-E, for the canonical WNT signalling target AXIN2 and of early neural genes (OTX2, rostral; GBX2, caudal), at 24 hours (n = 3 MiSTR tissues) and 48 hours of differentiation (n = 7 MiSTR tissues) under a 0 μM to 2 μM GSK3i gradient. Line graphs represent individual experiments of 24 hours (orange) and 48 hours (black). Heatmap displays normalized data at 48 hours for each gene, plus canonical WNT targets CCND1 and LEF1. 1-way ANOVA followed by Dunn’s (OTX2, GBX2, 48 hours) or Tukey’s (all others) multiple comparison test between all regions – only A to E comparisons are shown. For further comparisons and exact p-values see also Supplementary Fig. 1d and Supplementary Table 2.
(f) Representative whole-mount staining of a strip of 48-hour MiSTR tissue (n=3), showing decreased OTX2 (in red) along the imposed 0 μM to 2 μM GSK3i gradient (shown above).
(g) Representative overview of hESC-derived neural tissue after 14 days of culture in the MiSTR device. Note increased tissue opacity in comparison to 2 day-old MiSTR tissue, as the original monolayer of cells expands in thickness over time.
(h) Representative longitudinal section along the widest axis of MiSTR tissue after 14 days of culture (n=3). Magnified views (h’, h”) show the multicellular layer across the entire culture area, seeded at day 0 as a monolayer of hESCs.
(i) qRT-PCR analysis along the 5 positions, for OTX2 and GBX2, each line representing individual experiments. Red lines indicate experiments which failed the rostral-caudal patterning criterion (reciprocal fold change between regions A and E above 10 fold for both OTX2 and GBX2, see Methods). *p < 0.05; **p < 0.01; ***p < 0.001; **** p<0.0001; Tukey’s (GBX2) or Dunn’s (OTX2) multiple comparison test between all regions, n=32 MiSTR tissues. Schematics above show corresponding expression patterns in the embryo. See Supplementary Table 2 for p-values.
(j) Quantification of MiSTR tissues (from differentiation days d2 through d14) passing to the rostro-caudal patterning criterion.
(k) Normalized mean expression of OTX2 and GBX2 along the A-E regions of 14-day MiSTR tissues which passed the rostro-caudal criterion. Quantification of OTX2/GBX2 border localization, calculated arithmetically for each individual experiment (visualised as dotted line in graph). Data as mean SEM, n=22 MiSTR tissues.

