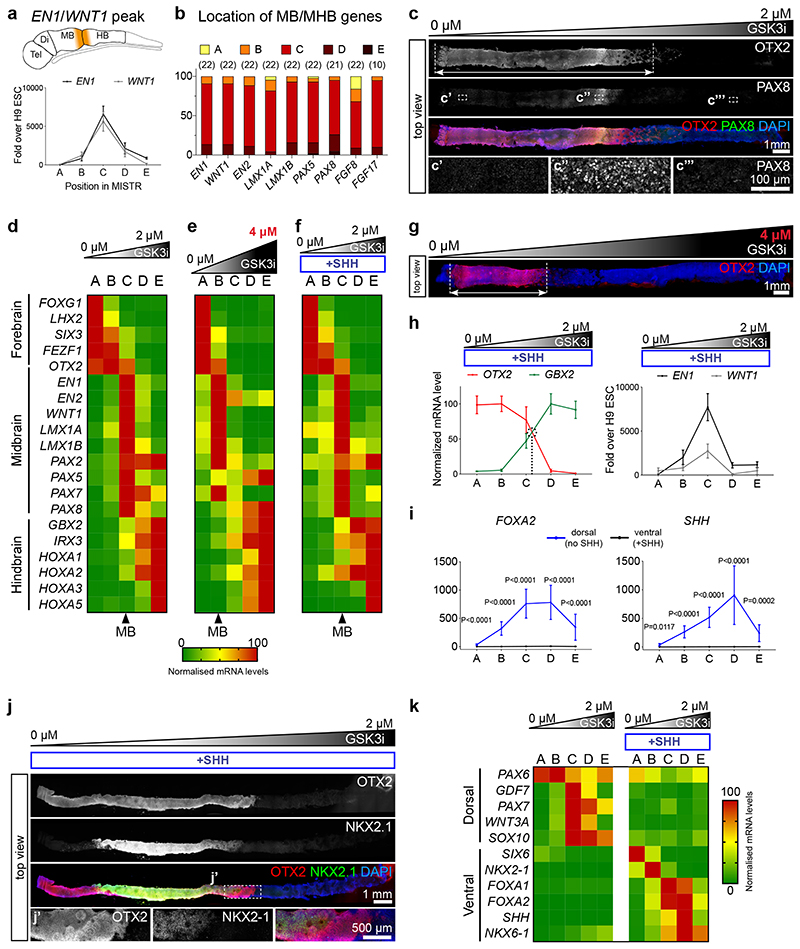
Figure 2. Neural patterning along the rostro-caudal axis in day 14 MiSTR tissue.
(a) qRT-PCR analysis along the 5 regions (A-E), for the MHB markers EN1 and WNT1, peaking at the central C regions (peak regions > 75 percentile values of gene expression, see Methods). Data as mean SEM, n = 22 MiSTR tissues.
(b) Quantification of location of peaked expression for markers of midbrain and MHB. Respective n is shown above.
(c) Representative whole-mount staining of 14-day MiSTR tissue (n=2), generated with a 0 μM to 2 μM GSK3i gradient. OTX2 staining (red) marks the forebrain/midbrain regions (arrow), while increased PAX8 (green) labels the MHB region.
(d) Normalized expression of forebrain, midbrain and hindbrain markers along the A-E regions of MiSTR tissue under a 0 μM to 2 μM GSK3i gradient. Arrowhead below marks the C region, with elevated midbrain (MB) markers. n = 17-24 MiSTR tissues. See Supplementary Fig. 2a.
(e) Normalized expression of forebrain, midbrain and hindbrain markers along the A-E regions of MiSTR tissue under the steeper 0 μM to 4 μM GSK3i gradient (shown above). Note the rostralized location of the midbrain markers in region B (arrowhead). n = 4 MiSTR tissues.
(f) Normalized expression of forebrain, midbrain and hindbrain markers along the A-E regions of ventralized MiSTR tissue (+SHH, SHH agonists added to entire tissue) under a 0 μM to 2 μM GSK3i gradient (shown above). n = 9 MiSTR tissues.
(g) Representative hole-mount staining of 14-day MiSTR tissue (n=2), with a 0 μM to 4 μM GSK3i gradient (shown above). OTX2 staining (red) marks the forebrain/midbrain regions (arrow), compressed at the low GSK3i side, in comparison with the 0 μM to 2 μM gradient. See also Supplementary Fig. 3a.
(h) Normalized mean expression of OTX2 and GBX2 along the 5 regions A-E of ventralized MiSTR (+SHH), and relative expression of the MHB markers EN1 and WNT1. Data as mean SEM, n = 9 MiSTR (+SHH) tissues.
(i) qRT-PCR analysis along the 5 regions A-E of dorsal (no SHH) and ventral (+SHH) MiSTR, for the ventral markers FOXA2 and SHH. 2-way ANOVA, followed by Sidak’s multiple comparison between no SHH and +SHH, for each region. Data as mean SEM, n=12 (SHH) and n = 19 (FOXA2) dorsal MiSTR tissues (no SHH), and n = 9 for ventral MiSTR (+SHH) tissues. See Supplementary Fig. 3b and Supplementary Table 2.
(j) Representative whole-mount staining of ventralised MiSTR tissue (+SHH) (n=3), showing the ventral diencephalic marker NKX2-1 (green) within the OTX2-positive region (red).
(k) Normalized expression of dorsal and ventral markers along the A-E regions of dorsal (no SHH) and ventral (+SHH) MiSTR tissue under a 0 μM to 2 μM GSK3i gradient. n = 9 ventral MiSTR tissues (+SHH), n = 10 to 19 dorsal MiSTR tissues (no SHH). Note expression of roof plate markers PAX7, GDF7, WNT3A and SOX10 in regions C and D. See also Supplementary Fig. 3b and Supplementary Table 2.

