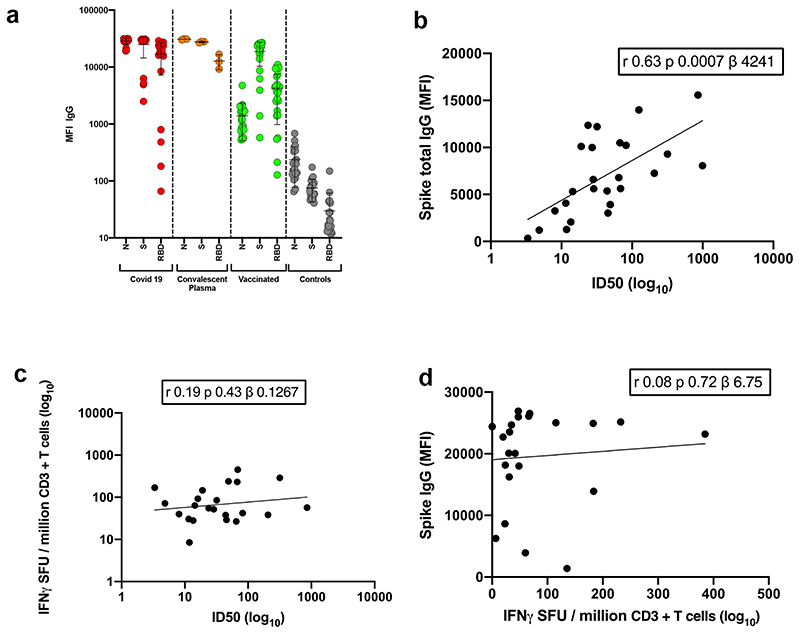
Extended Data Figure 1. Immune responses three weeks after first dose of Pfizer SARS-CoV-2 vaccine BNT162b2.
a, Serum IgG responses against N protein, Spike and the Spike Receptor Binding Domain (RBD) from first vaccine participants (green), recovered COVID-19 cases (red), 3 convalescent plasma units and healthy controls (grey) as measured by a flow cytometry based Luminex assay. MFI, mean fluorescence intensity. Geometric mean titre (GMT with standard deviation (s.d) of two technical repeats presented. b, Relationship between serum IgG responses as measured by flow cytometry and serum neutralisation ID50. c, Relationship between serum neutralisation ID50 and T cell responses against SARS-CoV-2 by IFN gamma ELISpot. SFU: spot forming units. d, Relationship between serum IgG responses and T cell responses. Simple linear regression is presented with Pearson correlation (r), P-value (p) and regression coefficient/slope (β).

