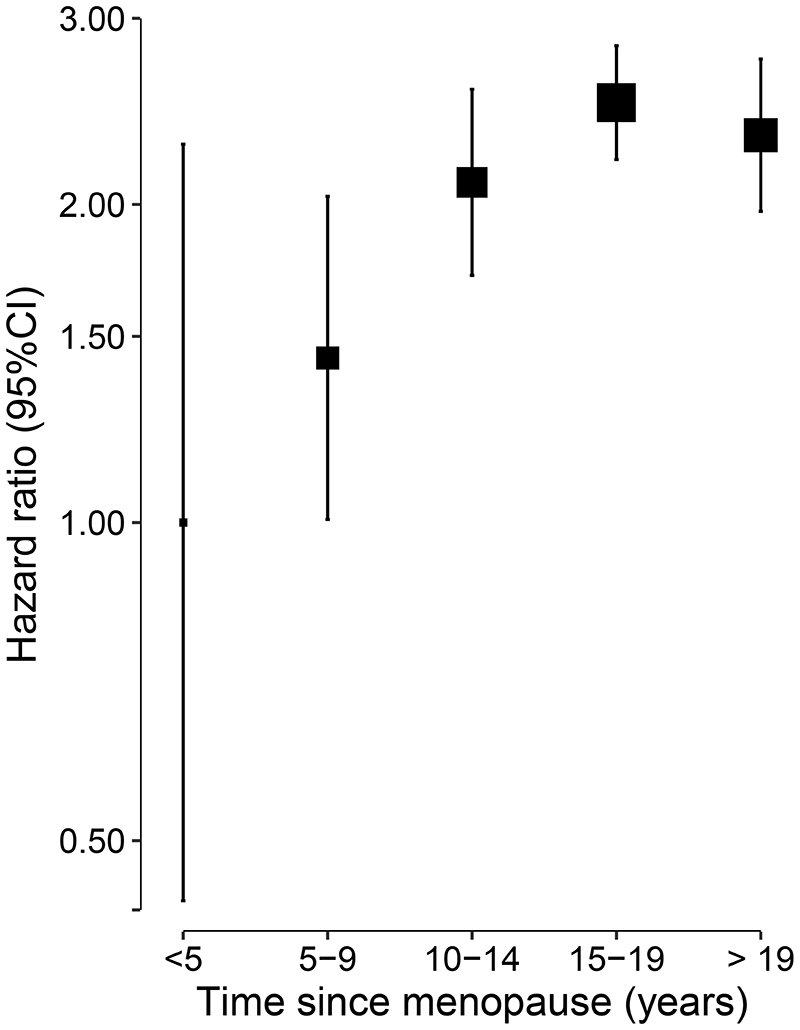
Figure 2. Adjusted hazard ratio (HR) and 95% CI for incident hip fracture by, time since menopause.
Models were stratified by age and study area, and adjusted for level of attained education, household income, marital status, diabetes, COPD, stroke, CHD, self-rated health, smoking status, alcohol use, dairy intake, fruit intake, soy intake, calcium intake, physical activity, body mass index (BMI) and reproductive factors including age at menarche, parity, abortion, age at first birth, breastfeeding duration per child, and oral contraceptive use. Squares represent the HR with area inversely proportional to the variance of the log HR. Vertical lines indicate the corresponding 95% CI.

