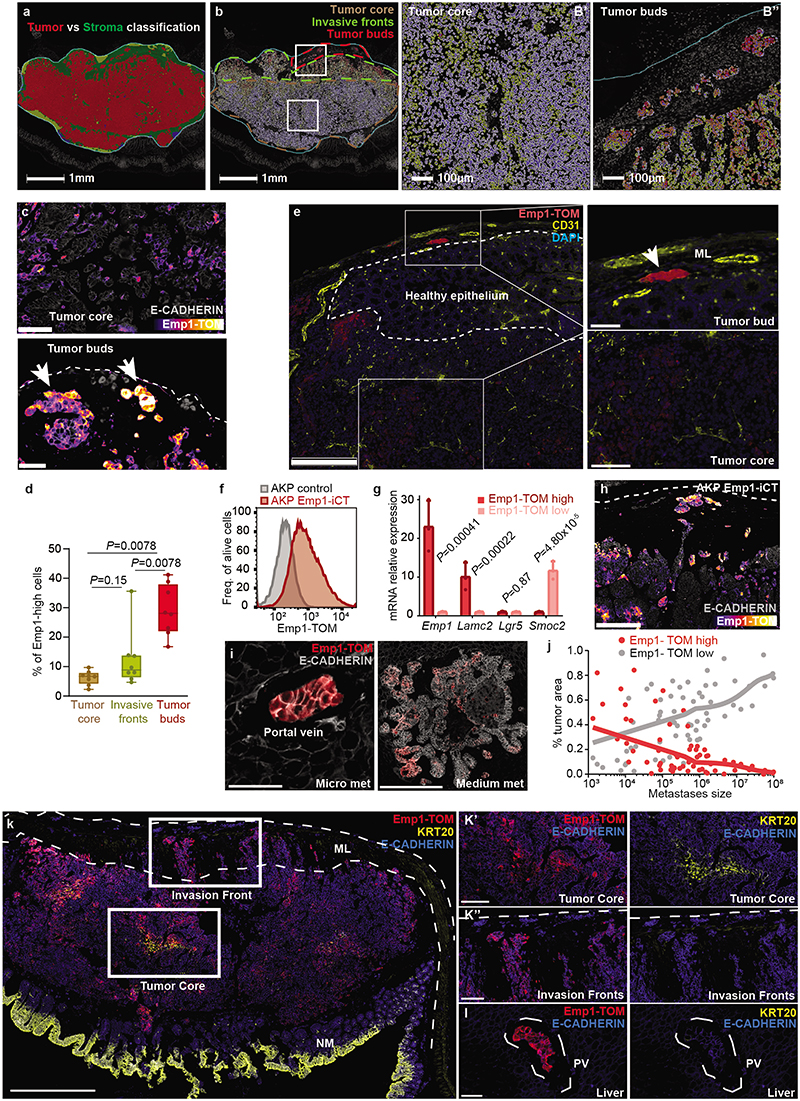
Extended Data Fig. 6 |. HRCs are enriched in invasion fronts and micrometastases.
a, Primary tumor outlined by cyan line and colored in 4 different regions identified with HALO image analysis classifier (tumor-red, stroma-green, background-yellow, necrosis-blue). Scale bar, 1mm. b, TOM cell intensity analysis in the tumor area after segmentation into individual cells. B’ and B” show magnified regions corresponding to tumor core (B’) and invasion fronts + tumor buds (B”). Scale bars, 1mm (B), 100 μm (B’ and B”). c, Representative immunostaining of TOM and E-CADH in the tumor core and in tumor buds of primary tumors derived from Emp1-iCT MTOs 4 weeks post implantation in the caecum. TOM fluorescence is shown with mpl-inferno LUT. The dashed line delimits the caecum edge. Arrows point to tumor buds. Scale bars, 100 μm (tumor core) 50 μm (tumor buds). d, Quantification of Emp1-TOMhigh (defined as cells in percentile 90 for TOM expression) in the tumor core (submucosal area), invasion fronts (inside muscular layer) and isolated glands (over muscular layer). Boxes represent the first, second (median) and third quartiles. Whiskers indicate maximum and minimum values. Two-sided Wilcoxon test on percentages. n= 8 mice. e, Immunofluorescence of TOM, CD31 and DAPI in primary tumors. Amplified insets show the tumor core and invasive glands intermingled in mucosal layers (ML) next to blood vessels. Dashed lines outline healthy intestinal epithelium. Scale bars, 250 μm, 100 μm (tumor core) and 50 μm (tumor buds). f, Representative flow cytometry plot of TOM expression in wild-type and Emp1-iCT AKP MTOs. g, Relative mRNA expression in Emp1-TOMhigh and Emp1-TOMlow sorted cell populations from Emp1-iCT AKP MTOs. Two-sided t-test after normalizing by Ppia. n=3 technical replicates. Mean +/- SD. h, Representative immunostaining for TOM and E-CADHERIN in Emp1-iCT AKP tumors implanted in the caecum 4 weeks post-implantation. Emp1-TOM fluorescence is shown with an mpl-inferno LUT. Dashed lines delimit the edge of the caecum. Scale bar: 250 μm. i, Representative images of TOM and E-CADHERIN staining in micro (left) and medium (right) size metastases. Scale bars: 50 μm and 250 μm. j, Percentage of tumor area containing TOM-high and low fluorescent pixels versus metastases size (in pixels). Each dot represents an individual metastasis. k, TOM, KRT20 and E- CADHERIN staining in primary tumors generated by Emp1-iCasp9-tdTomato AKTP MTOs. Dashed lines encompass invasion fronts and tumor buds. KRT20 staining is observed in normal mucosa (NM) and to a lesser extent in the tumor core. Tumor cell clusters invading the muscular layer (ML) express high levels of TOM and no KRT20. Amplified insets show an example of tumor core (K’) and invasion fronts (K”) with TOM (left) and KRT20 (right) stainings. Scale bars, 500 μm (k) and 100 μm (K’ and K”). l, Immunofluorescence of TOM and E-CADHERIN (left) and KRT20 and E-CADHERIN (right) in a cluster of tumor cells that enter the liver through a portal vein (PV, delimited with dashed lines). Scale bar, 50 μm.

