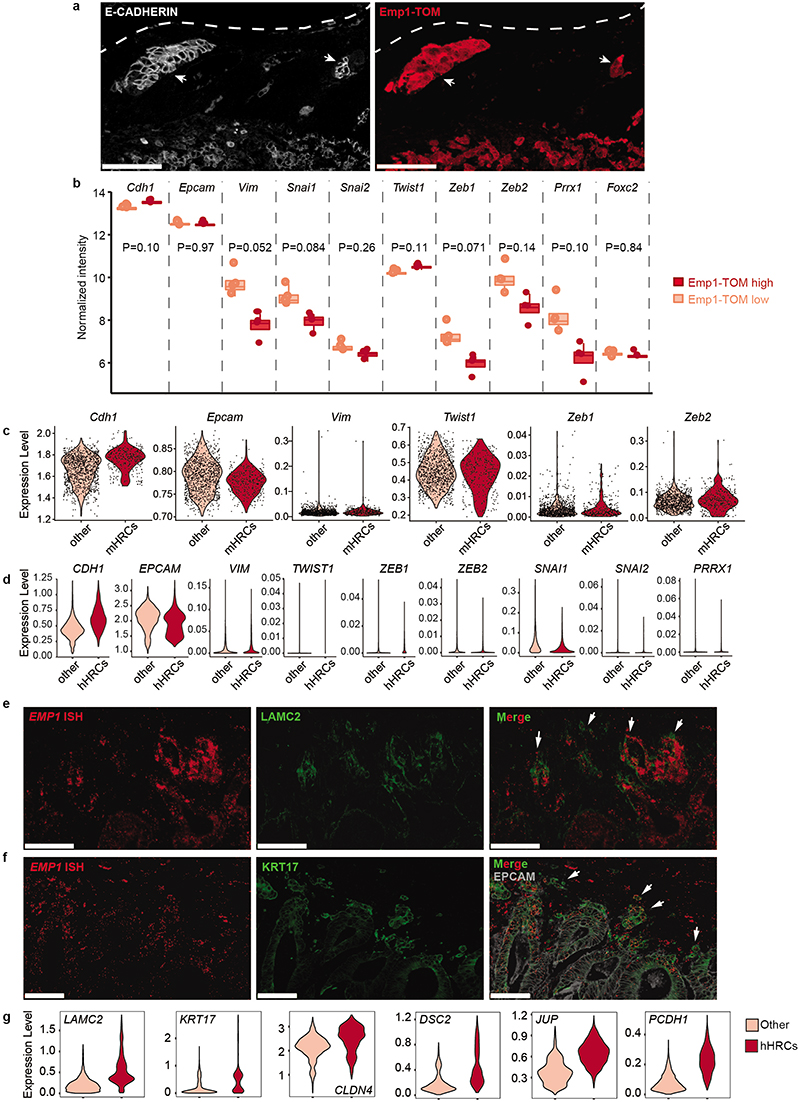
Extended Data Fig. 7 |. HRCs retain an epithelial phenotype.
a, Immunostaining of E-CADHERIN and TOM in Emp1-iCT primary tumors 4 weeks post-implantation of MTOs. Arrows point at examples of E-CADHERIN+ invasion fronts and tumor buds. Dashed lines show the caecum edge. Scale bars, 100 μm. b, Boxplot showing normalized expression of genes related to EMT in Emp1-TOMhigh versus Emp1- TOMlow cells. Box plots have whiskers of maximum 1.5 times the interquartile range; Boxes represent first, second (median) and third quartiles. P-value for differential expression with Linear Model for Microarray Analysis (limma). n=4 biological replicates. c-d, Violin plots showing expression of selected EMT-related genes in HRCs versus the rest of other cells in mouse epithelial primary tumor cells (c) and human tumor cells from the SMC cohort (d). Genes present in b not shown (Snai1 and Snai2) were undetected in (c). e, Representative example of EMP1 mRNA FISH combined with LAMC2 immunofluorescence on human primary CRC tissue section showing an overlapping pattern of expression of EMP1 and LAMC2 in invasion fronts and tumor buds (arrows). Scale bar, 100 μm. f, Representative example of EMP1 mRNA FISH combined with KRT17 and EPCAM immunofluorescence on human primary CRC tissue sections showing an overlapping pattern of expression of EMP1 and KRT17 in invading fronts and tumor cell clusters (arrows). Scale bars, 100 μm. g, Violin plots showing enrichment of LAMC2, KRT17 and several cell-to-cell adhesion genes in HRCs (SMC cohort).

