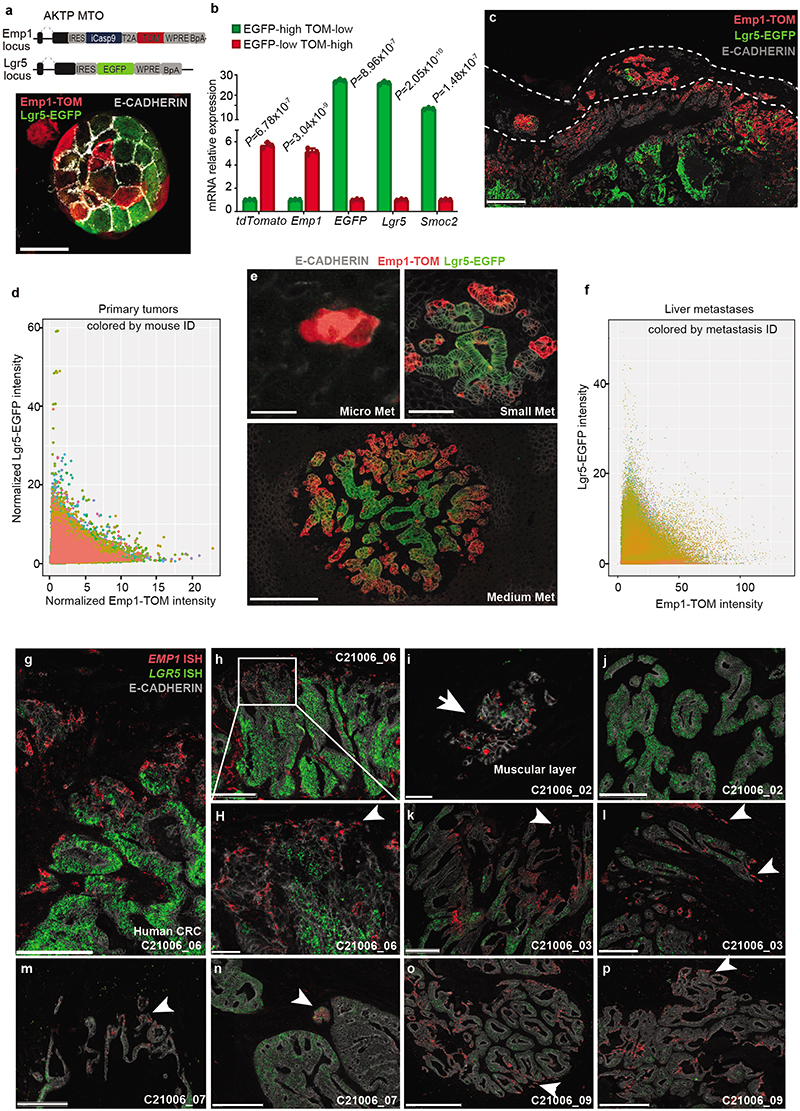
Extended Data Fig. 8 |. Emp1 and Lgr5 mark distinct tumor cell populations.
a, Emp1-iCasp9-tdTomato and Lgr5-EGFP alleles introduced in AKTP MTOs. Confocal imaging of TOM, EGFP and E-CADHERIN immunostaining in edited MTOs. Single z-plane. Scale bar, 10 μm. b, Relative mRNA expression in EGFP-high/TOM-low and EGFP-low/TOM-high sorted cells dissociated from subcutaneous AKTP Emp1-iCT Lgr5-EGFP tumors. Two-sided t-test after normalizing by PPIA. Mean +/- SD. n= 3 technical replicates. c, Immunostaining of TOM, EGFP and E-CADHERIN in Emp1-iCT Lgr5-EGFP primary tumors 4 weeks post-implantation of MTOs in the caecum. Dashed lines encompass tumor buds. Scale bar, 250 μm. d, Scatter plot showing normalized Emp1-TOM intensity versus normalized Lgr5-EGFP intensity in 855,330 cells from 18 different primary tumors. Note the absence of double positive cells (TOM and EGFP high). e, Representative immunofluorescence staining of TOM, EGFP and E-CADHERIN in liver metastases of increasing size (micro, small, medium) generated from the mouse CRC relapse model. Scale bars, 25 μm (micro) 100 μm (small) 250 μm (medium). f, Scatter plot showing TOM intensity versus EGFP intensity in 318,276 cells from 137 different liver metastases. Note the absence of double positive cells (TOM and EGFP high). g-p, Examples of dual EMP1 and LGR5 mRNA ISH combined with E-CADHERIN immunofluorescence on human primary CRC tissue sections demonstrating a mutually exclusive pattern of expression of EMP1 and LGR5. Note that EMP1 expression is elevated in invasion fronts and tumor cell buds (white arrows). Scale bars, 500 μm (l, p) 250 μm (g, h, i, j, m, n, o) 50 μm (H’, k).

